Synopsis: Kotak Mahindra Bank Ltd has formed an ascending triangle on the 1-day chart, signalling a possible short-term bullish breakout.
An ascending triangle is a bullish continuation pattern marked by higher lows and a flat resistance line. The chart shows a confirmed bullish breakout above the resistance neckline. Supported by volume surge and points to a potential short-term upward move.
Kotak Mahindra Bank broke above the key resistance level of Rs 386 on Friday and managed to stay above it, turning the level into a strong support zone. The stock closed at Rs 387.05 on the daily chart, indicating continued bullish momentum.
In an ascending triangle, traders typically target the nearest resistance level or project a price move equal to the triangle’s height from the breakout point, using strong volume and momentum to confirm the trade.
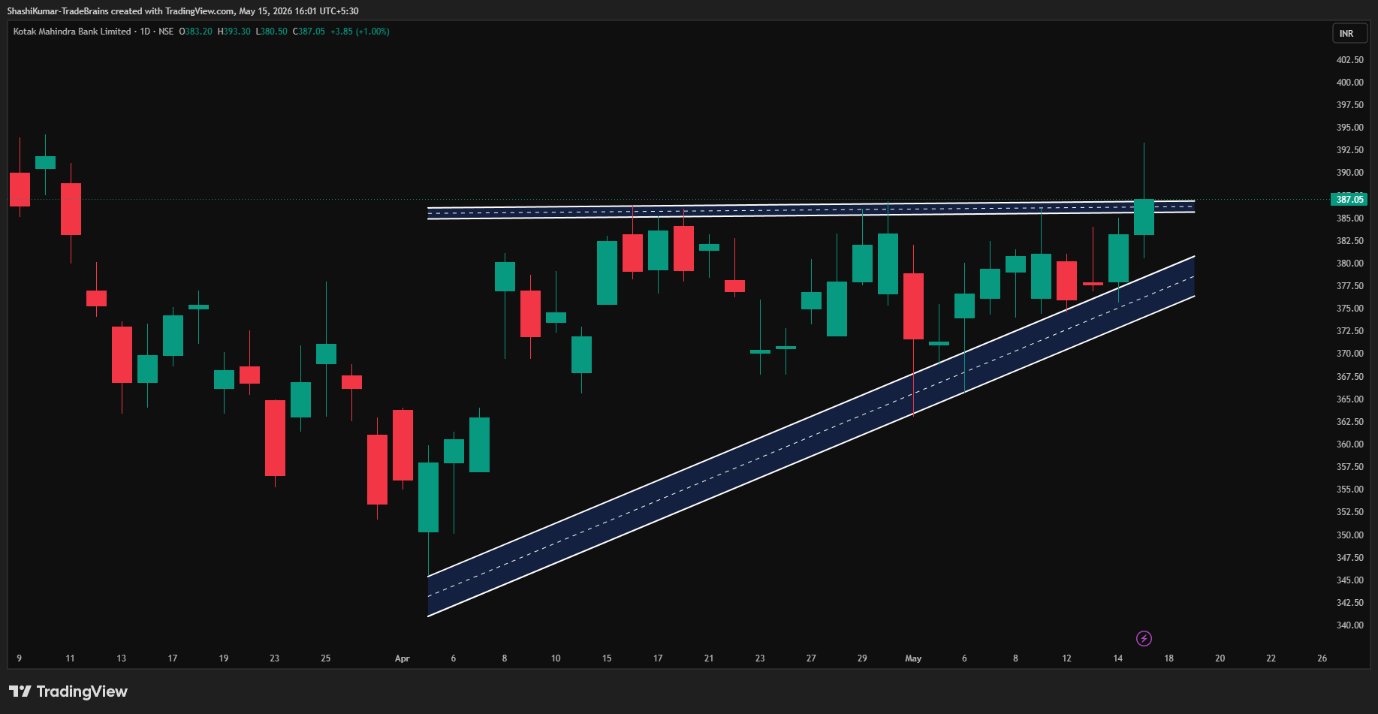
Kotak Mahindra Bank Ltd Chart: 1-day Timeframe
Indicator Confirmation
- RSI: The daily RSI indicates buying pressure, as it rose from 54.73 in the previous trading session to 57.76 on Friday.
- Price Volume Trend: The Price Volume Indicator confirms the uptrend, accompanied by an increase in buying volume in the daily timeframe.
- MACD: On the daily time frame, the blue MACD line is above the orange signal line, with the histogram turning green, indicating bullish momentum.
- Moving Averages: On the daily time frame, the 5-day EMA was above the 9-day EMA, further confirming a bullish trend.
Implications
The ascending triangle pattern indicates continued upside potential. Maintaining levels above the Rs 386 support mark, especially with strong trading volumes, would further strengthen the near-term bullish outlook.
About the stock
Kotak Mahindra Bank is one of India’s leading private sector banks, headquartered in Mumbai and founded by Uday Kotak. The bank offers a wide range of financial services, including retail banking, corporate banking, insurance, investment banking, asset management, and stockbroking. Known for its strong digital banking initiatives and customer-focused services, Kotak Mahindra Bank has built a strong presence across India with thousands of branches, ATMs, and a growing digital ecosystem.
Kotak Mahindra Bank has gained 1.6% recently, showing signs of short-term strength. However, the stock remains under pressure, declining 7.63% over the past six months and down 7.78% on a year-over-year basis. For more such technical stock ideas, clickhereto view our research page.
Disclaimer: The views and investment tips expressed by investment experts/broking houses/rating agencies on tradebrains.in are their own, and not that of the website or its management. Investing in equities poses a risk of financial losses. Investors must therefore exercise due caution while investing or trading in stocks. Trade Brains Technologies Private Limited or the author are not liable for any losses caused as a result of the decision based on this article. Please consult your investment advisor before investing.
The post Kotak Mahindra Bank Forms an Ascending Triangle Pattern Signalling a Potential Bullish Breakout appeared first on Trade Brains.