Synopsis: Hindustan Zinc Ltd has exhibited a bearish reversal pattern on its 4‑hour chart, signalling potential near-term downward momentum.
Hindustan Zinc, after experiencing a prolonged uptrend in recent trading sessions, has formed a double top pattern in the 4-hour time frame, signalling a potential bearish reversal.
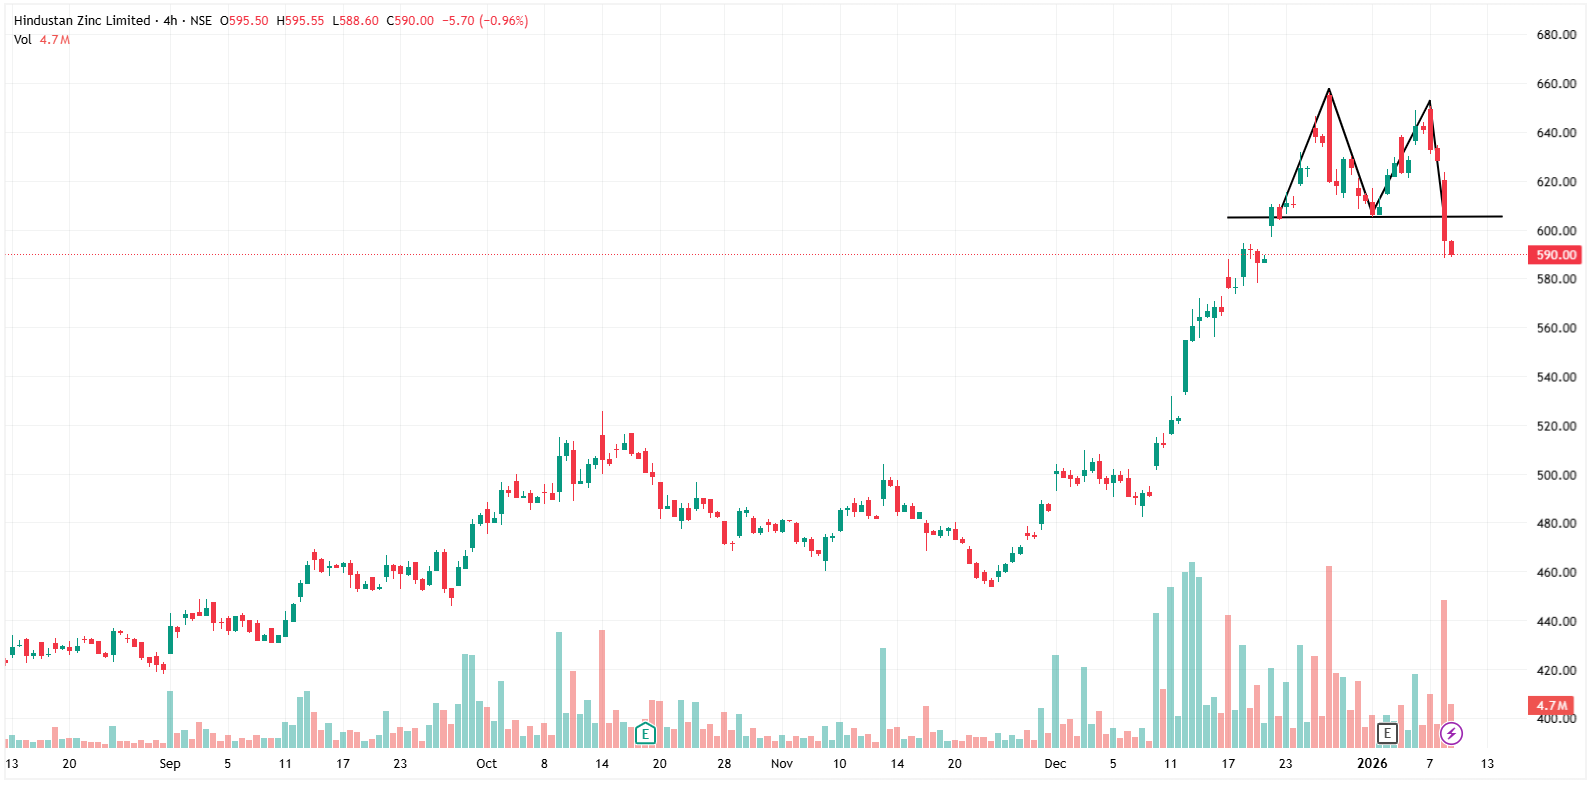
(4-Hour Timeframe)
The double top is a classic bearish reversal pattern, characterised by two peaks formed at roughly the same price level, separated by a moderate pullback. This formation suggests that buying pressure is weakening and signals a potential shift from an uptrend to a downtrend once the price breaks below the support level (the neckline).
On Thursday, the stock broke below the Rs 605 support neckline after forming a Double top pattern. This breakdown, accompanied by increased selling volumes, confirms near-term bearish momentum.
The downside target for this pattern is typically calculated by measuring the distance between the peak level and the neckline and then projecting that distance downward from the point of breakdown. As the price approaches this projected target, traders often look to book profits or reassess their positions.
Indicator Confirmation
- RSI: The daily RSI shows bearish momentum, as it dropped from 70 in the last trading session to 52.6 on Thursday, confirming the continuation of the downtrend.
- MACD: The orange signal line crossed above the Blue MACD line, with the histogram turning red, indicating bearish momentum.
- Moving Averages: On the 4-hour time frame, the 5-day moving average has crossed below the 9-day moving average, further confirming a bearish trend.
- Price Volume Trend: The Price Volume Indicator confirms the trend, supported by a decline in trading volume.
Implications
This bearish double-top breakdown suggests the potential for further downside momentum. A decisive close below the neckline support, ideally supported by higher volumes, is needed to confirm the move and minimise the risk of a false breakdown. On the upside, resistance is likely around Rs 605, while sustained trading below the breakdown zone would signal continued bearish pressure.
About the stock
Hindustan Zinc Ltd, a Vedanta Group company, is the world’s largest integrated zinc producer and ranks among the top five silver producers globally. The company exports to over 40 countries and commands an approximate 77% share of India’s primary zinc market.
Over the past month, Hindustan Zinc Ltd delivered a 20.3% return, while in the last six months, it achieved a 35.26% return. Over the past year, it provided a 32.94% return.
For more such technical stock ideas, Click here to view our research page.
Disclaimer: The views and investment tips expressed by investment experts/broking houses/rating agencies on tradebrains.in are their own, and not that of the website or its management. Investing in equities poses a risk of financial losses. Investors must therefore exercise due caution while investing or trading in stocks. Trade Brains Technologies Private Limited or the author are not liable for any losses caused as a result of the decision based on this article. Please consult your investment advisor before investing.
The post Vedanta Group Stock Shows Bearish Signs After Double Top Formation; Check the details appeared first on Trade Brains.