U.S. bonds are on track to log ten straight six-month periods of underperformance relative to stocks, a record-breaking stretch of underperformance since 2020 that’s rippling through markets and shaking up traditional investor portfolios.
The streak spans five years and reflects a regime shift in global markets—one driven by rising interest rates, an overstretched fiscal backdrop, and a tech-driven equity boom.
Yet with geopolitical tensions escalating in Iran, some may wonder whether the prolonged cycle of bond underperformance compared to stocks might finally turn.
See Also: War, Oil, And S&P 500: Here’s How The Stock Market Behaves In Energy Crises
Bond Market Underperformance
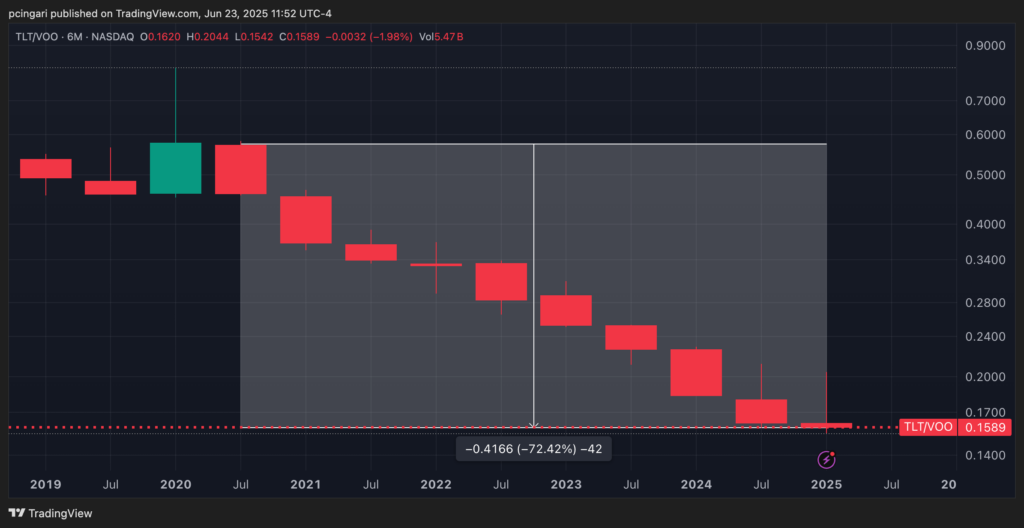
A way to assess the relative performance of the bond market compared to the stock market is by tracking the ratio between the iShares 20+ Year Treasury Bond ETF (NYSE:TLT) and the Vanguard S&P 500 ETF (NYSE:VOO); below is a table showing this dynamic over the past 10 consecutive half-year periods.
| Period | TLT/VOO Ratio | TLT Return | S&P 500 Return |
|---|---|---|---|
| 2020 H2 | -20.65% | -3.80% | +21.30% |
| 2021 H1 | -20.07% | -8.48% | +14.50% |
| 2021 H2 | -7.46% | +2.70% | +10.94% |
| 2022 H1 | -2.44% | -22.48% | -20.54% |
| 2022 H2 | -14.43% | -13.33% | +1.29% |
| 2023 H1 | -10.81% | +3.39% | +15.92% |
| 2023 H2 | -10.44% | -3.94% | +7.25% |
| 2024 H1 | -18.93% | -7.18% | +14.50% |
| 2024 H2 | -11.68% | -4.85% | +7.73% |
| 2025 H1 (thru June 23) | -2.15% | -0.10% | +2.05% |
Chart: TLT vs. VOO – A 70% Underperformance Over Five Years