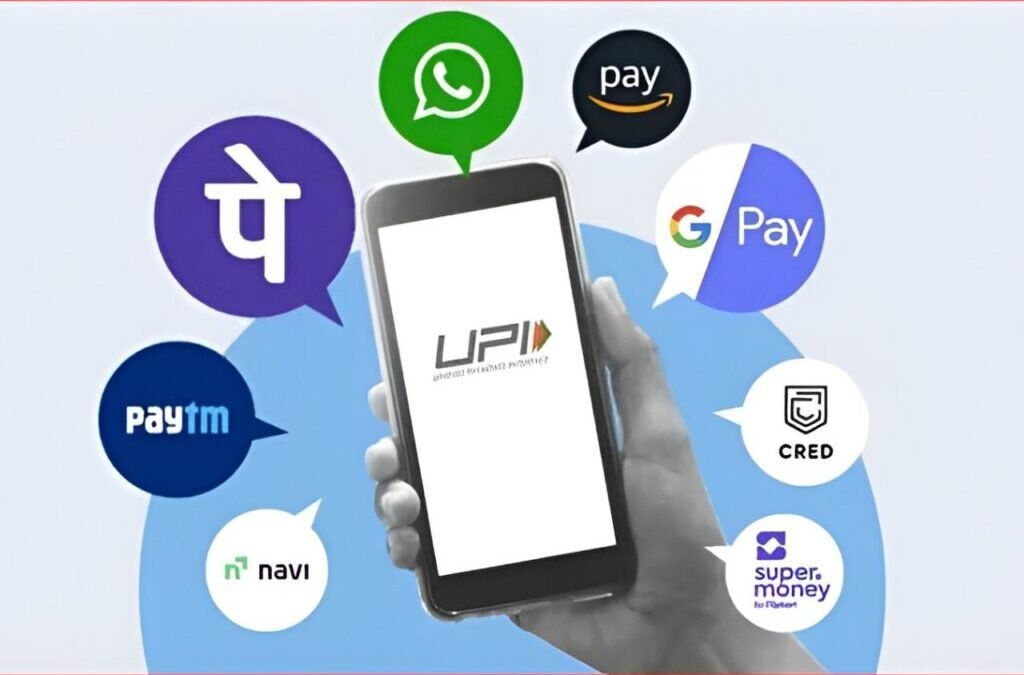
Synopsis- India’s UPI system processed 19.63 billion transactions worth around ₹24.9 lakh crore in September, 2025. This article list out top 10 UPI Apps ranking according to the latest transaction volume.
UPI continues to empower India’s digital economy, with over 19.63 billion transactions driven by leading players like PhonePe, Google Pay, Paytm, and Amazon Pay as well as the expansion of digital payments as competitive businesses in India are growing.
UPI Market (September 2025) – App-wise Transaction Volumes and Value
1. PhonePe
- Transactions volume – 8.96 billion
- Transaction value – ₹12,03,000 crore
- App Market Share – 45.6%
- MoM change – -0.1%
2. Google Pay
- Transactions volume – 6.83 billion
- Transaction value – ₹8,70,000 crore
- App Market Share – 34.8%
- MoM change – -0.5%
3. Paytm
- Transactions volume – 1.39 billion
- Transaction value – ₹1,50,000 crore
- App Market Share – 7.1%
4. Navi

- Transactions volume – 0.53 billion
- Transaction value – ₹26,500 crore
- App Market Share – 2.7%
- MoM growth – +5%
5. Super.money (Flipkart)

- Transactions volume – 0.25 billion
- Transaction value – ₹9,900 crore
- App Market Share – 1.3%
- MoM growth – Stable
Also read: Top 10 Indian States Leading in Digital Transformation in 2025 – Guess Which One Leads
6. Cred

- Transactions volume – 0.15 billion
- Transaction value – ₹23,500 crore
- App Market Share – 0.8%
- MoM change – -0.4%
7. FamApp by Trio

- Transactions volume – 0.14 billion
- Transaction value – ₹1,751 crore
- App Market Share – 0.7%
- MoM growth – +7.9%
8. BHIM
- Transactions volume – 0.24 billion
- Transaction value – ₹12,800 crore
- App Market Share – 1.2%
- MoM growth – +3%
9. Amazon Pay

- Transactions volume – 0.11 billion
- Transaction value – ₹7,200 crore
- App Market Share – 0.6%
- MoM growth – -0.4%
10. WhatsApp Pay

- Transactions volume – 0.10 billion
- Transaction value – ₹8,400 crore
- App Market Share – 0.5%
- MoM growth – +1.2%
Key insights
- Although transaction volume fell slightly from August’s 20.01 billion (again, primarily because there were less working days), transaction value increased marginally, suggesting a consistent number of users and possibly larger ticket payments.
- According to NPCI data, daily transaction counts averaged 654 million in September (₹82,991 crore/day), compared to 645 million in August, indicating a growing trust in digital payments.
- The grocery, food, and telecom sectors delivered the most transaction volumes, collectively accounting for 35% of total P2M payments.
Factors Contributing to Growth of GCCs
- Widely Accepted by Merchants: More than 400 million merchants accept UPI payments thanks to easy QR-code scanning and zero fees for merchants.
- Rising Usage by Small Businesses: Kirana shops and micro-enterprises are using UPI increasingly, with small retail businesses representing nearly 40% of merchant payment volume.
- Government Programs: Programs under Digital India and other incentives lead to trust and usage across demographics.
- Digital Lending & Credit UPI: Offers using credit and wallet functionality and pull payments too, leading to increased usage beyond P2P transactions.
- Cross-Border Use: UPI has cross-border integration with select partner countries, including the UAE, Singapore, Nepal, and more. Fully integrated payment and transaction in these markets leads to greater usage.
- New Fintech Innovations: New offerings from tech-based payment companies, including features like UPI 2.0, recurring payments, and embedded finance functionality lead to payments being utilized.
Conclusion
UPI in September 2025 slightly declined compared to August 2025. Digital transaction kind of locks it in as the real backbone for payments in India’s digital economy. You know, stuff like future innovations and keeping things fair in competition. Those will push it toward going global. And they’ll make digital inclusion happen for more people too.
Written By Rachna Rajput
The post Top 10 UPI Apps with Highest Transactions in September 2025; See Who Leads the Chart appeared first on Trade Brains.