On Friday, the Nifty 50 showed a positive bounce, finishing the day higher after reaching an intraday peak. The broader market also followed suit with modest gains. Technical indicators reflected strength, with key momentum and trend measures signalling continued upward support.
Investor sentiment improved noticeably, as reflected by a significant drop in market volatility, suggesting reduced anxiety among traders. Most sectoral indices closed in positive territory, with the energy and real estate sectors leading the gains, driven by strong performances from key companies within those industries. However, some sectors, particularly metals, faced selling pressure and ended the day lower, dragged down by major players experiencing declines.
In contrast to the upbeat domestic market, several major Asian markets saw weakness, while the U.S. futures pointed to a cautious start for the coming week. Overall, despite the positive close on Friday, market participants remained cautious for the week ahead amid concerns over upcoming corporate earnings, potential policy changes, and ongoing geopolitical uncertainties.
In this overview, we will analyze the key technical levels and trend directions for Nifty and BSE Sensex to monitor in the upcoming trading sessions. All the charts mentioned below are based on the 5-minute timeframe.
Nifty 50
(In this analysis, we have used 20/50/100/200 EMAs, where 20 EMA (Red), 50 EMA (Orange), 100 EMA (Light Blue), and 200 EMA (Dark Blue)).
To view other technical reports, click here
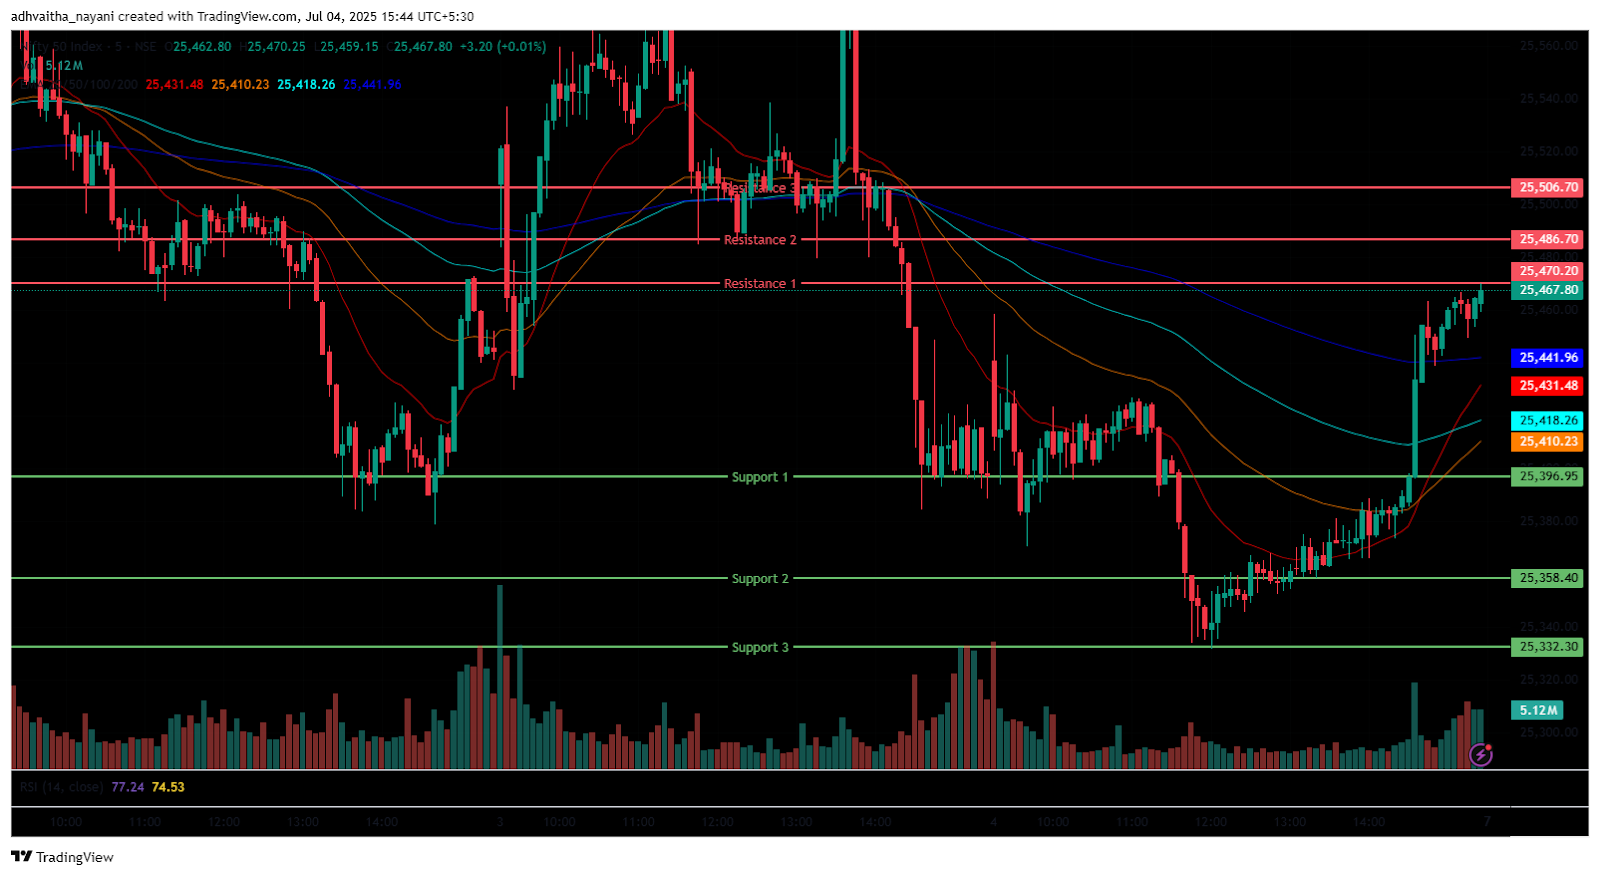
The Nifty 50 Index opened in green at 25,429 on Friday, up 24 points from Thursday’s closing of 25,453.40. The Nifty Index was volatile in the morning session, and was trading in the range of 25,300 and 25,400. It was consolidating around the opening level of 25,400 and was below 20/50/100 EMAs in the 15-minute time frame in the morning session and traded near the 200-day EMA. In the afternoon session, the Nifty Index gradually picked up the momentum and rebounded from its day’s low of 25,332 and closed in green at 25,461. During noon, it traded below all four EMAs, but later closed above 20/50/100/200 EMAs in the 15-minute time frame in the afternoon session.
Nifty’s immediate resistance levels are R1 (25,470), R2 (25,487), and R3 (25,507), while immediate support levels are S1 (25,397), S2 (25,358), and S3 (25,332). The Nifty index had reached a day’s high at 25,470.25, closed in green above the 25,450 mark, and saw a day’s low at 25,332. Finally, it had closed above the opening level at 25,461, gaining 55.7 points or 0.22%. The Relative Strength Index (RSI) stood at 61 (below the overbought zone of 70) in the daily time frame, and Nifty 50 closed above the four 20/50/100/200 EMAs in the daily time frame.
Bank Nifty
(In this analysis, we have used 20/50/100/200 EMAs, where 20 EMA (Red), 50 EMA (Orange), 100 EMA (Light Blue), and 200 EMA (Dark Blue)).
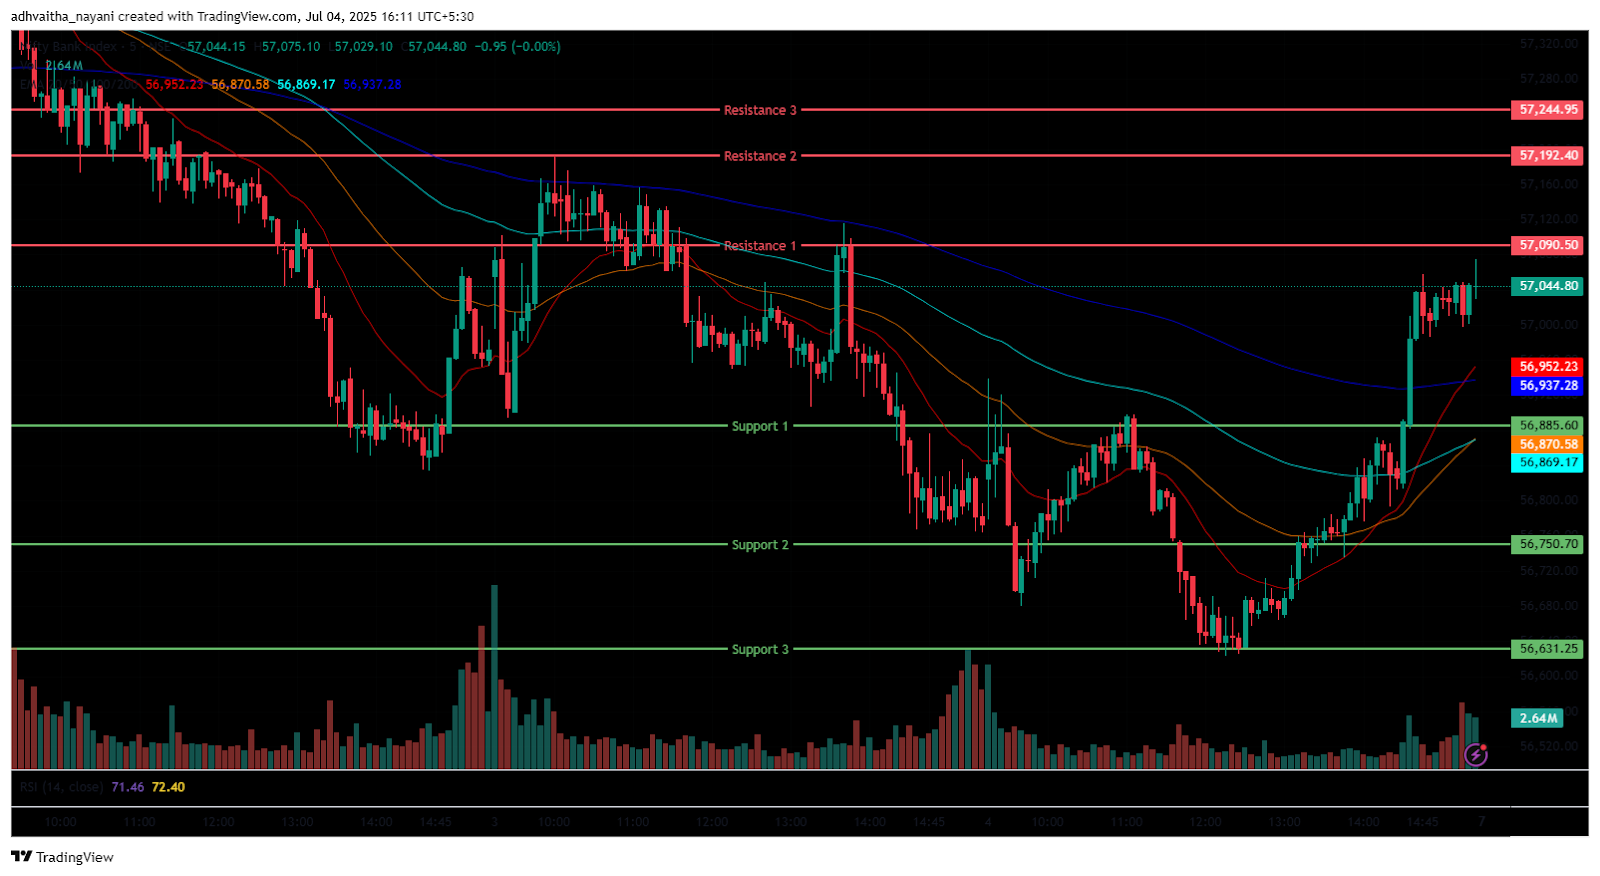
The Bank Nifty Index also followed a similar trend as Nifty 50, opening at 56,825 on Friday, up by 33 points from Thursday’s closing of 56,792. It was trading between the range of 56,700 and 56,800 levels in the morning session, indicating volatility, and was below the 20/50/100/200 EMAs in the 15-minute time frame. In the afternoon session, the Bank Nifty recovered from its day’s low of 56,624 and closed above the 57,000 mark, around 57,031.90. During noon, it traded below all four EMAs, but later closed above 20/50/100/200 EMAs in the 15-minute time frame in the afternoon session.
Bank Nifty immediate resistance levels are R1 (57,091), R2 (57,192), and R3 (57,245), while immediate support levels are S1 (56,886), S2 (56,751), and S3 (56,631). The Bank Nifty index had peaked at 57,075 and had a day’s low at 56,624. Finally, it had closed near its day’s high in green at 57,031.9, up by 239.95 points or 0.42%. The Relative Strength Index (RSI) stood at 59 (below the overbought zone of 70) in the daily time frame, and Bank Nifty was above the 20/50/100/200 EMAs in the daily time frame.
Sensex
(In this analysis, we have used 20/50/100/200 EMAs, where 20 EMA (Red), 50 EMA (Orange), 100 EMA (Light Blue), and 200 EMA (Dark Blue)).
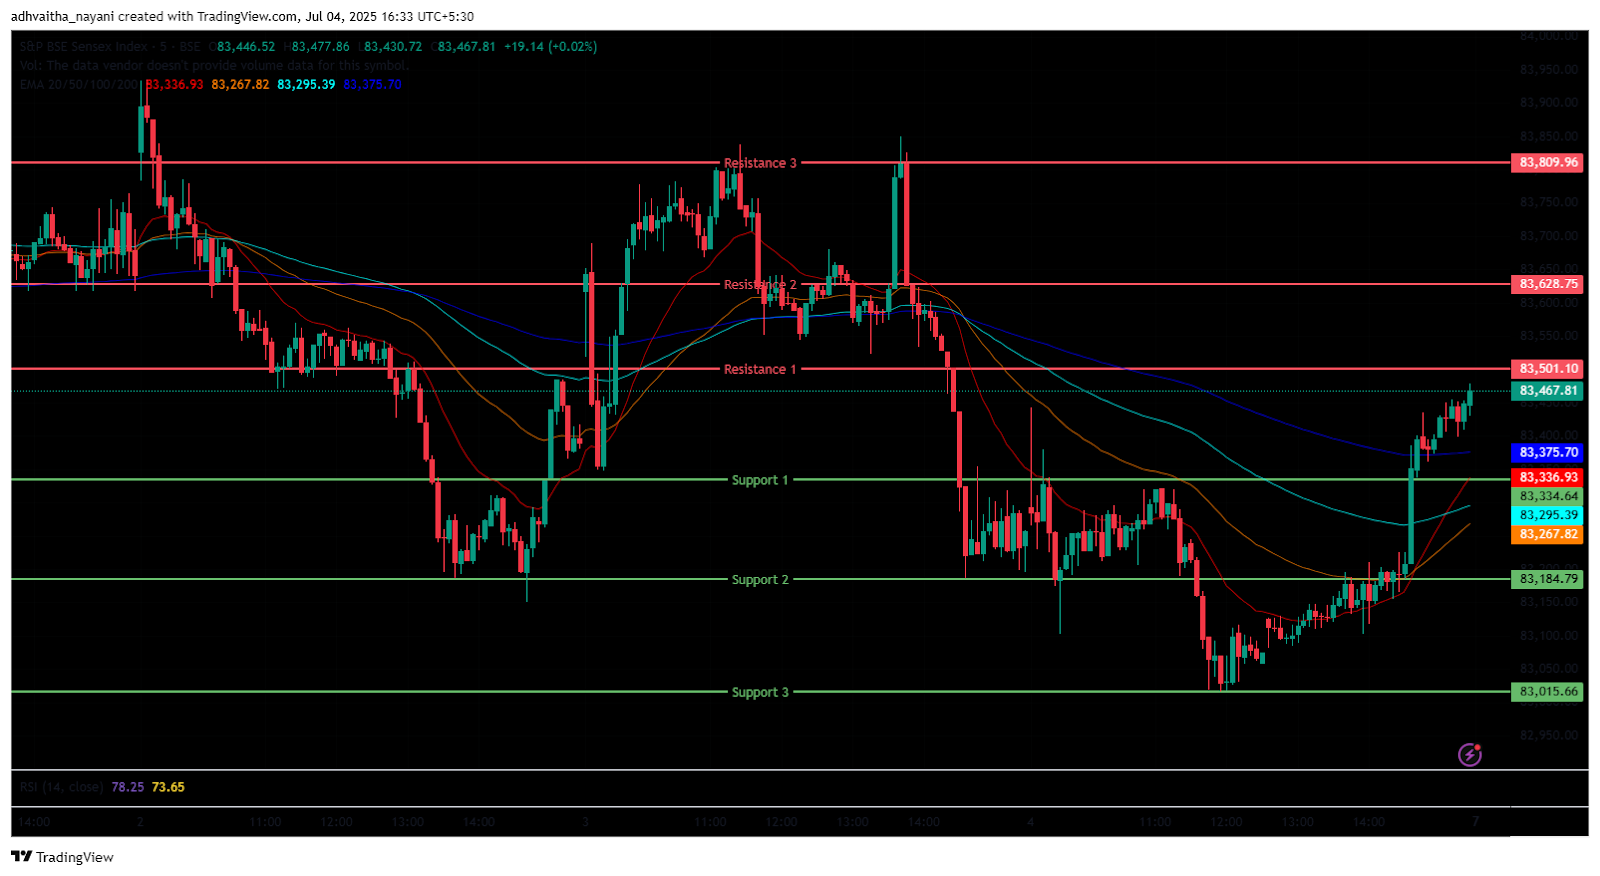
The BSE Sensex Index followed the same trend, opening at 83,307 on Friday, up by 68 points from Thursday’s closing of 83,239. The Index was volatile in the morning session, and was trading in the range of 83,150 and 83,250. It was consolidating near the opening level of 83,260 and was below 20/50/100 EMAs in the 15-minute time frame in the morning session and traded near the 200-day EMA. In the afternoon session, the Sensex Index gradually picked up the momentum and bounced back from its day’s low of 83,016 and closed in green at 83,432.89. During noon, it traded below all four EMAs, but later closed above 20/50/100/200 EMAs in the 15-minute time frame in the afternoon session.
BSE Sensex immediate resistance levels are R1 (83,501), R2 (83,629), and R3 (83,810), while immediate support levels are S1 (83,335), S2 (83,185), and S3 (82,015). The BSE Sensex index had peaked at 83,478 and had a day’s low at 83,016. Finally, it closed at 83,432.89, up by 193.42 points or 0.23%. The Relative Strength Index (RSI) stood at 59.85 (below the overbought zone of 70) in the daily time frame, and BSE Sensex was above all four 20/50/100/200 EMAs in the daily time frame.
India VIX
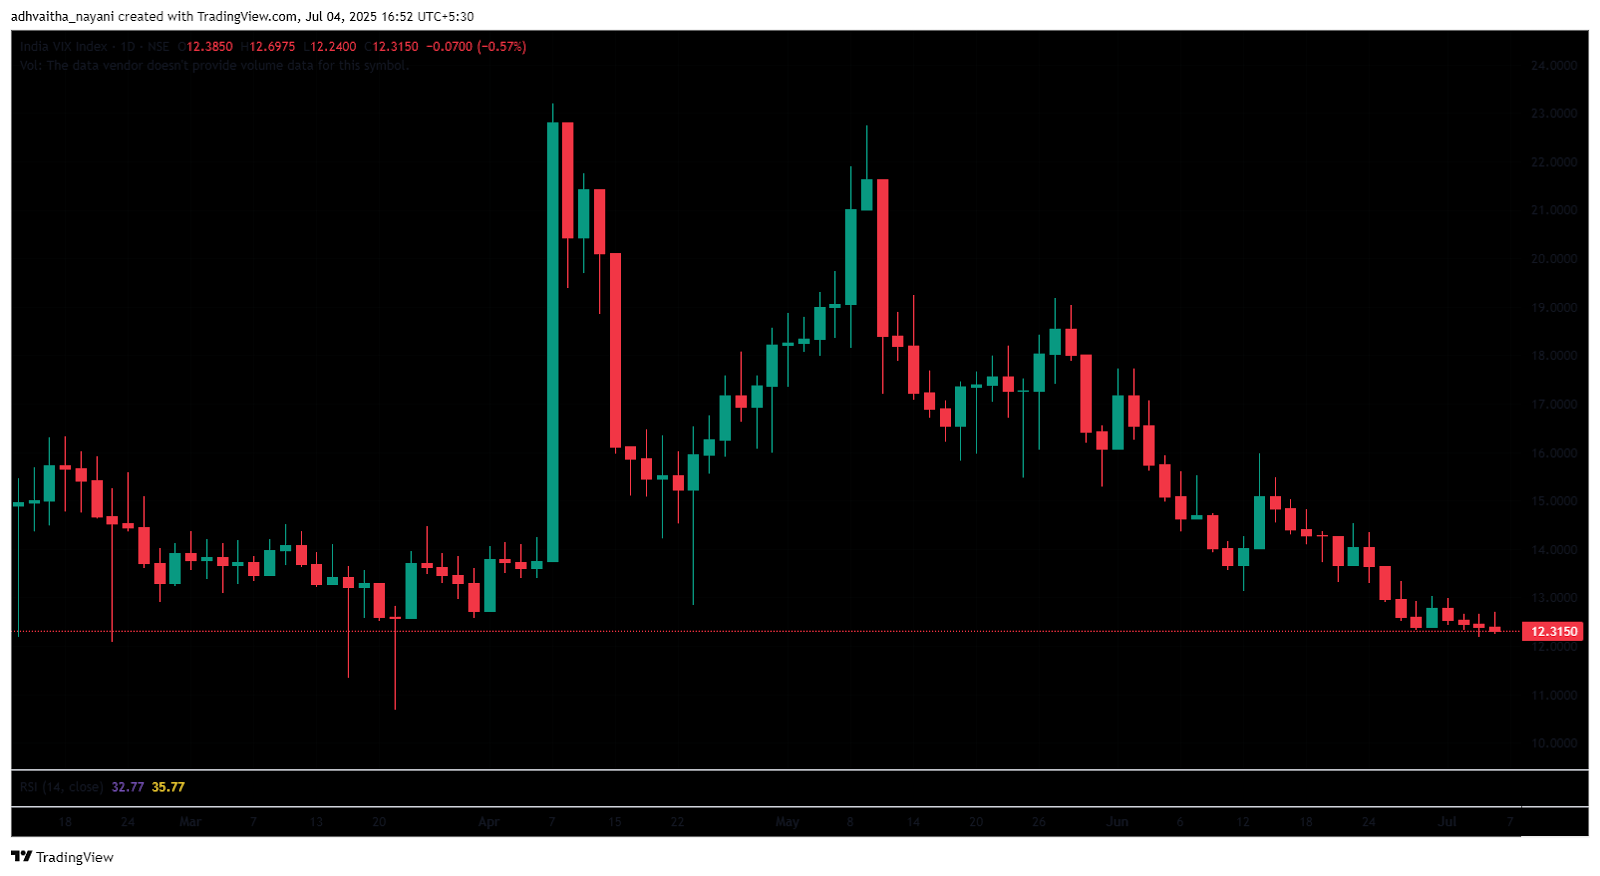
The India VIX decreased from 12.39 to 12.32 on Friday, down by 0.070 points or 0.57%. The slight decrease in the VIX index shows an ease in market volatility.
To view other technical reports, click here
Market Recap, July 4th, 2025
On Friday, the Nifty 50 opened at 25,428.85, touched an intraday high of 25,470.25, and closed near its peak at 25,461.00, up 55.70 points or 0.22% for the day. The BSE Sensex also gained ground, rising 193.42 points or 0.23%, closing at 83,432.89 from an opening level of 83,306.81. Technical indicators showed strength, with the Nifty 50’s RSI at 61.01 and the index trading above its 20, 50, 100, and 200-day EMAs. Similarly, the Sensex ended above all its key moving averages, with an RSI of 59.85, well below the overbought threshold of 70.
Volatility continued to decline, with the India VIX falling to a nine-month low of 12.32, suggesting reduced investor anxiety and an improvement in market sentiment. Most sectoral indices ended the day in the green. The Nifty Oil & Gas index was one of the top performers, closing at 12,002.35, up 125.05 points or 1.05%. Bharat Petroleum, Indraprastha Gas, and Indian Oil Corporation led the gains in this sector, with increases of up to 4.43%. The Nifty Realty index also saw notable gains, ending the day at 971.95, up 0.91%, driven by strong performances from Raymond Realty, Brigade Enterprises, and Phoenix Mills, each gaining over 2%.
On the downside, the Nifty Metal index was among the few laggards, closing at 9,580.40, down 43.05 points or 0.45%. Jindal Stainless, Tata Steel, and SAIL weighed on the sector, each declining by more than 1.3%.
Asian markets showed mixed to bearish trends. The Hong Kong Hang Seng dropped 115.89 points or 0.48% to 23,916.06, while South Korea’s Kospi slumped 2.04% or 62.37 points to 3,054.28. Japan’s Nikkei 225 remained mostly flat, inching up 24.98 points or 0.06% to 39,810.88. China’s Shanghai Composite gained 11.17 points or 0.32%, closing at 3,472.32. Meanwhile, U.S. Dow Jones Futures declined 258.37 points or 0.58%, ending at 44,572.15.
Despite Friday’s rebound, the Nifty 50 ended the week down 0.69%, indicating cautious investor sentiment due to upcoming Q1FY26 earnings reports, potential tariff updates, and ongoing geopolitical developments.
Trade Setup Summary
The Nifty 50 opened in green on Friday but was volatile in the morning session, but rebounded later in the afternoon session, and closed on a positive note at 25,461, peaking at 25,470. A break below 25,397 could trigger further selling towards 25,358, while a break above 25,470 could trigger bullishness towards 25,487.
Bank Nifty opened on a similar trend, opening in green and ending at 57,031.9, above the 57,000 mark. A break below 56,886 could trigger further selling towards 56,751, while a break above 56,090.5 could trigger bullishness towards 57,192.
Sensex opened on a similar trend, opening on a positive note, and ended above the 83,400 level at 83,432.8. A break below 83,335 could trigger further selling towards 83,185, while breaking the next resistance level of 83,501 could lead towards the 83,629 level.
Given the ongoing volatility and mixed sentiments, it’s advisable to avoid aggressive positions and wait for clear directional moves above resistance or below support. Traders should consider these key support and resistance levels when entering long or short positions following the price break from these critical levels. Additionally, traders can combine moving averages to identify more accurate entry and exit points.
Disclaimer

The views and investment tips expressed by investment experts/broking houses/rating agencies on tradebrains.in are their own, and not that of the website or its management. Investing in equities poses a risk of financial losses. Investors must therefore exercise due caution while investing or trading in stocks. Trade Brains Technologies Private Limited or the author are not liable for any losses caused as a result of the decision based on this article. Please consult your investment advisor before investing.
About: Trade Brains Portal is a stock analysis platform. Its trade name is Dailyraven Technologies Private Limited, and its SEBI-registered research analyst registration number is INH000015729.
Investments in securities are subject to market risks. Read all the related documents carefully before investing.
Registration granted by SEBI and certification from NISM in no way guarantee performance of the intermediary or provide any assurance of returns to investors.
The post Technical View: Nifty, Bank Nifty & Sensex Trade Setup and Key levels to watch for 7th July appeared first on Trade Brains.