Indian equity markets witnessed a volatile trading session on Friday, starting the day on a positive note but failing to sustain the early gains as selling pressure emerged across key sectors. After opening slightly higher, both the Nifty 50 and the Sensex slipped into negative territory, weighed down by profit booking and cautious investor sentiment ahead of the release of key U.S. inflation data. Despite the decline, benchmark indices continued to trade above their crucial moving averages, indicating underlying strength in the broader market trend.
Throughout the week, domestic indices demonstrated resilience, supported by strong technical levels and steady global cues, despite concerns surrounding U.S.-India trade discussions and valuation pressures triggering intermittent corrections. While select sectors, such as metals, oil & gas, and real estate, outperformed, led by robust buying interest, others, including healthcare, banking, and FMCG, dragged down the overall market performance. Asian markets, meanwhile, maintained a largely upbeat tone, reflecting optimism across regional equities, while U.S. futures signalled a mildly positive opening ahead of key economic data releases.
In this overview, we will analyse the key technical levels and trend directions for Nifty and BSE Sensex to monitor in the upcoming trading sessions. All the charts mentioned below are based on the 5-minute timeframe.
Nifty 50
(In this analysis, we have used 20/50/100/200 EMAs, where 20 EMA (Red), 50 EMA (Orange), 100 EMA (Light Blue), and 200 EMA (Dark Blue)).
To view other technical reports, click here
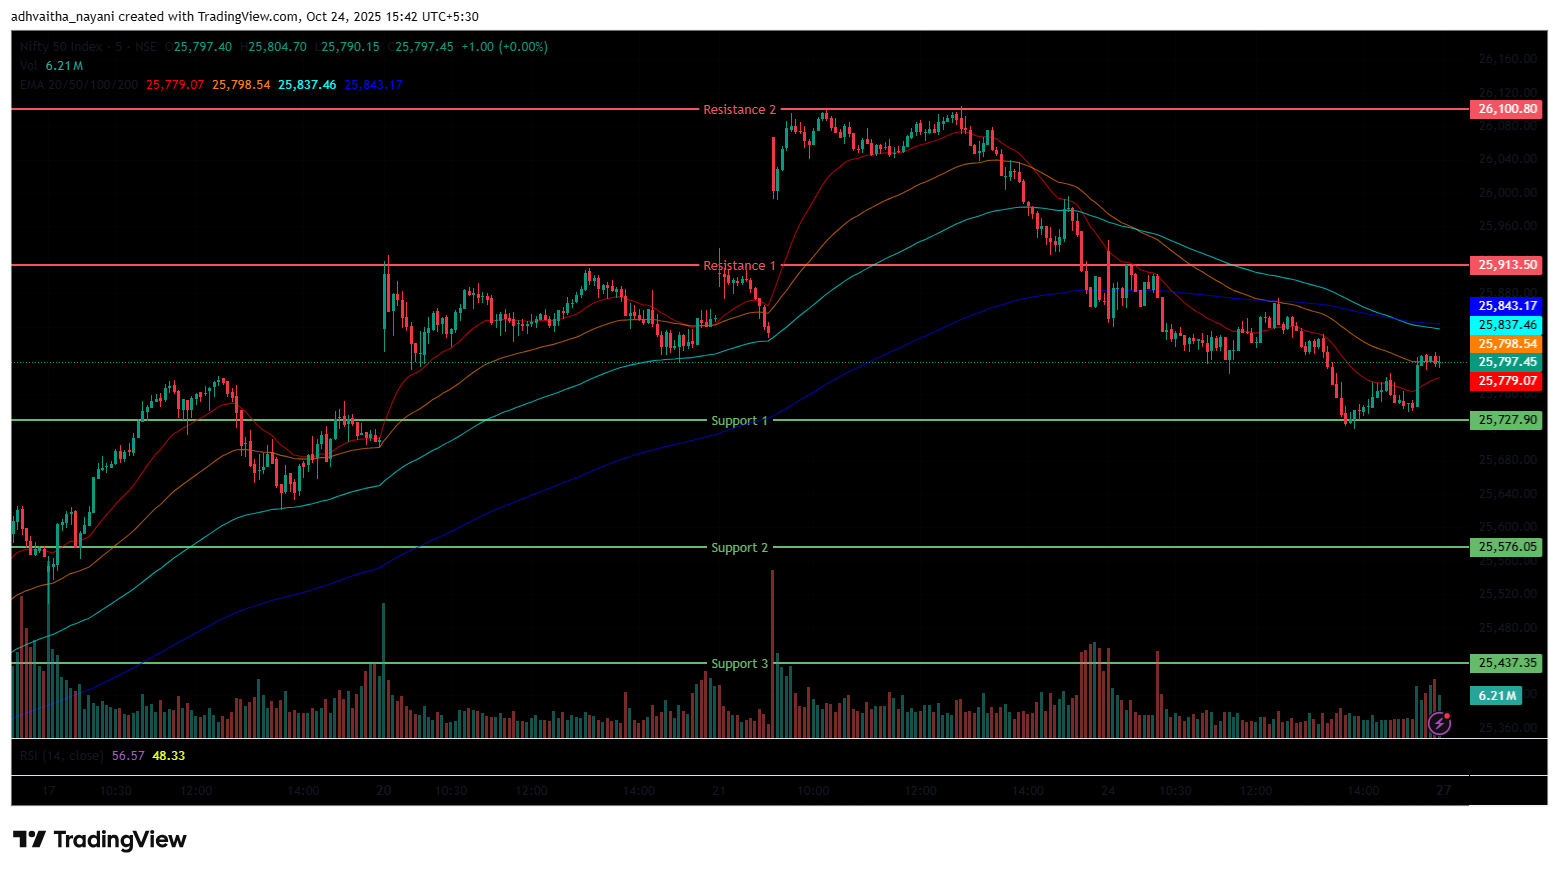
The Nifty 50 Index opened on a positive note at 25,935.10 on Friday, up by 43.7 points from Thursday’s closing of 25,891.40. The index had a bullish start and surged as high as 25,944, marking its day high in the morning session. But later the index lost its momentum and dragged down to the 25,784 mark. Further, the Index was trading in the range of 25,750 to 25,950 and was trading below the EMAs of 20/50 but remained above the EMAs of 100/200 in the 15-minute time frame during the morning session.
In the afternoon session, the index further pulled down to 25,718, marking its day low and was trading within the 25,700-25,850 range. During the afternoon session, the Nifty 50 was closed below the EMAs of 20/50/100 but remained above the 200 EMA in the 15-minute time frame. The Nifty’s immediate resistance levels are R1 (25,913) and R2 (26,101), while immediate support levels are S1 (25,728), S2 (25,576), and S3 (25,437).
The Nifty index had reached a day’s high at 25,944.15 and saw a day’s low at 25,718.20. Finally, it had closed at 25,795.15, in the red below the 25,800 level, losing 96.25 points, or 0.37%. The Nifty 50 closed above all four EMAs of 20/50/100/200 in the daily time frame.
Momentum Indicators
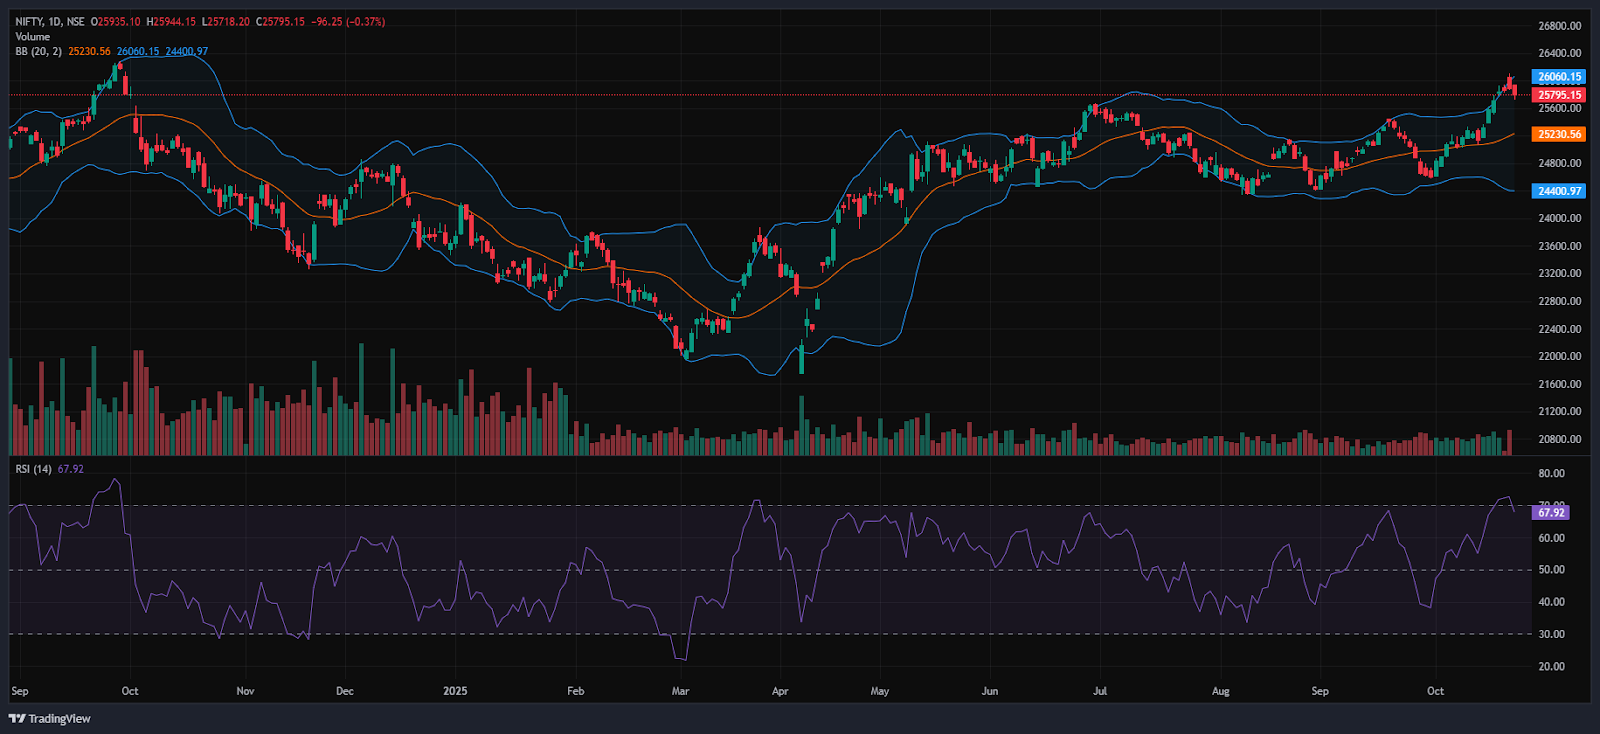
RSI (Daily): The Nifty 50’s RSI stood at 67.92, which is below the overbought zone of 70, indicating bullish sentiment.
Bollinger Bands (Daily): The index is trading in the upper band of the Bollinger Band range above the middle band (Simple Moving Average). Its position in the upper range indicates a bullish sentiment, and the Index took support near 25,718 and 25,944 acted as a resistance level. A sustained move above the middle band signals a bullish sentiment, while a drop back toward the lower band may reinforce bearish sentiment.
Volume Analysis: Friday’s trading session had average volumes, which stood at 278.6 Mn.
Derivatives Data: Options OI indicates strong Put writing at 25,750, followed by 25,700, establishing it as a firm support zone. On the upside, a significant Call OI buildup at 25,800 and 25,900 suggests a potential resistance supply. PCR (Put/Call Ratio) stands at 0.6536 (<1), leaning towards bullish sentiment, and the Long-unwinding signals a Strong bearish outlook, with an overall mixed outlook for the next trading session.
Bank Nifty
(In this analysis, we have used 20/50/100/200 EMAs, where 20 EMA (Red), 50 EMA (Orange), 100 EMA (Light Blue), and 200 EMA (Dark Blue)).
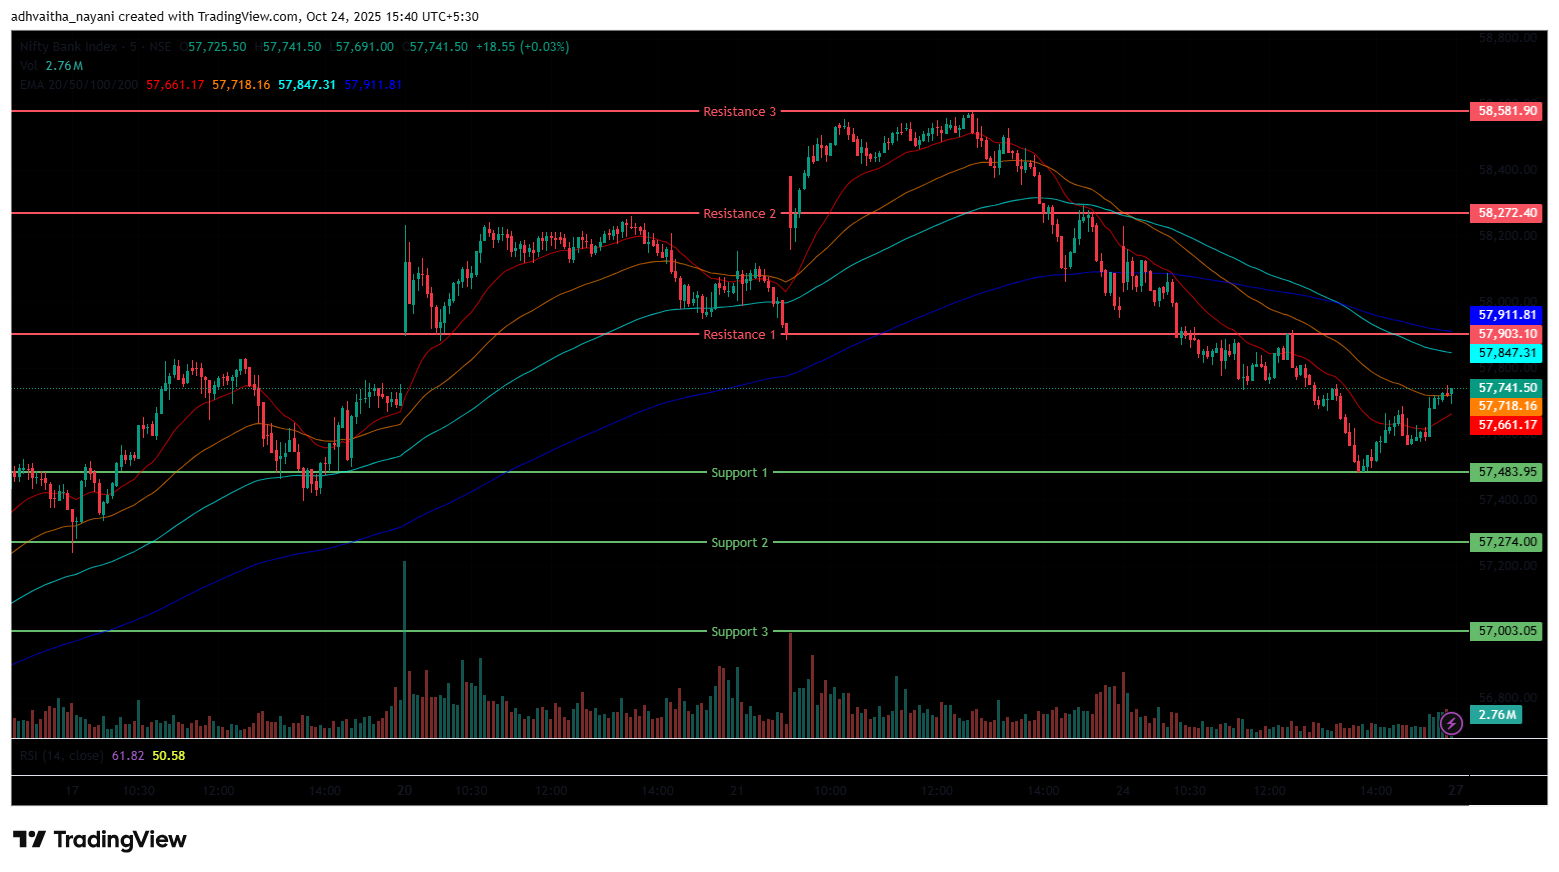
The Bank Nifty Index started the session on a positive at 58,172.75 on Friday, up by 94.7 points from Thursday’s closing of 58,078.05. The index was trading between the range of 57,700 and 58,250 in the morning session and surged as high as 58,232.9 marking its day high in the morning session. In addition, the index was trading below EMAs of 20/50/100 but remained above the 200 EMA in the 15-minute time frame.
In the afternoon session, the Index was further pulled down to 57,482 and took support near the 200-day EMA. Further, the Index was trading in the range of 57,450 and 57,800, and ended in red and settled below the 57,800 mark. During the afternoon session, Bank Nifty closed below the EMAs of 20/50/100 but remained above the 200 EMA in the 15-minute time frame. The Bank Nifty’s immediate resistance levels are R1 (57,903), R2 (58,272), and R3 (58,582), while immediate support levels are S1 (57,484), S2 (57,274), and S3 (57,003).
The Bank Nifty index had peaked at 58,232.90 and made a day’s low at 57,482.05. Finally, it had closed in red at 57,699.60, closing below the 57,700 level, losing 378.45 points or 0.65%. The Relative Strength Index (RSI) stood at 68.70, below the overbought zone of 70 in the daily time frame, and Bank Nifty closed above all four EMAs of 20/50/100/200 in the daily time frame.
Sensex
(In this analysis, we have used 20/50/100/200 EMAs, where 20 EMA (Red), 50 EMA (Orange), 100 EMA (Light Blue), and 200 EMA (Dark Blue)).
To view other technical reports, click here
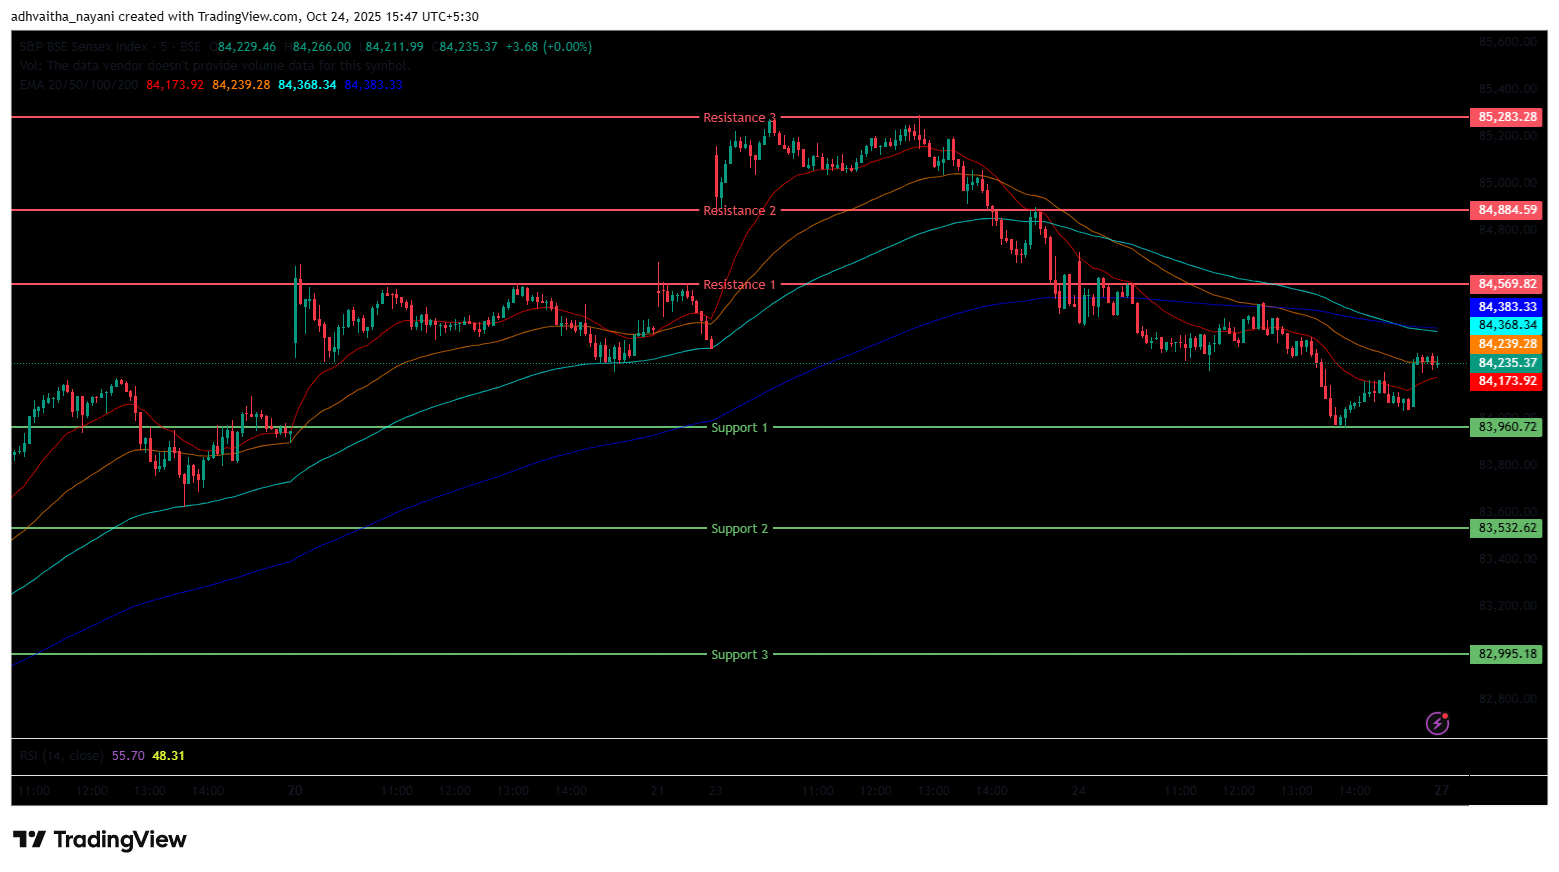
The BSE Sensex Index also opened on a positive note at 84,667.23 on Friday, up by 110.83 points from Thursday’s closing of 84,556.40. The index started its session on a bullish note but was later dragged down to the 84,200 level due to uncertainty regarding the US-India trade deal, as well as profit booking after the recent rally in the indices. The Index was trading in the 84,200 and 84,750 range throughout the morning session and was trading below the EMAs of 20/50 but remained above the 100/200 EMAs in the 15-minute time frame.
In the afternoon session, the Index further lost its momentum and ended near the 84,200 level. The Index was trading around 83,900 and 84,400, maintaining its overall bearish trend and closing below the EMAs of 20/50/100 but remained above the 200 EMA in the 15-minute time frame. The BSE Sensex immediate resistance levels are R1 (84,570), R2 (84,885), and R3 (85,283), while immediate support levels are S1 (83,961), S2 (83,533), and S3 (82,995).
The BSE Sensex index had peaked at 84,707.44 and made a day’s low at 83,957.15. Finally, it had closed at 84,211.88 in red, losing 344.52 points or 0.41%. The Relative Strength Index (RSI) stood at 67.78, below the overbought zone of 70 in the daily time frame, and the BSE Sensex closed above all four EMAs of 20/50/100/200 in the daily time frame.
India VIX
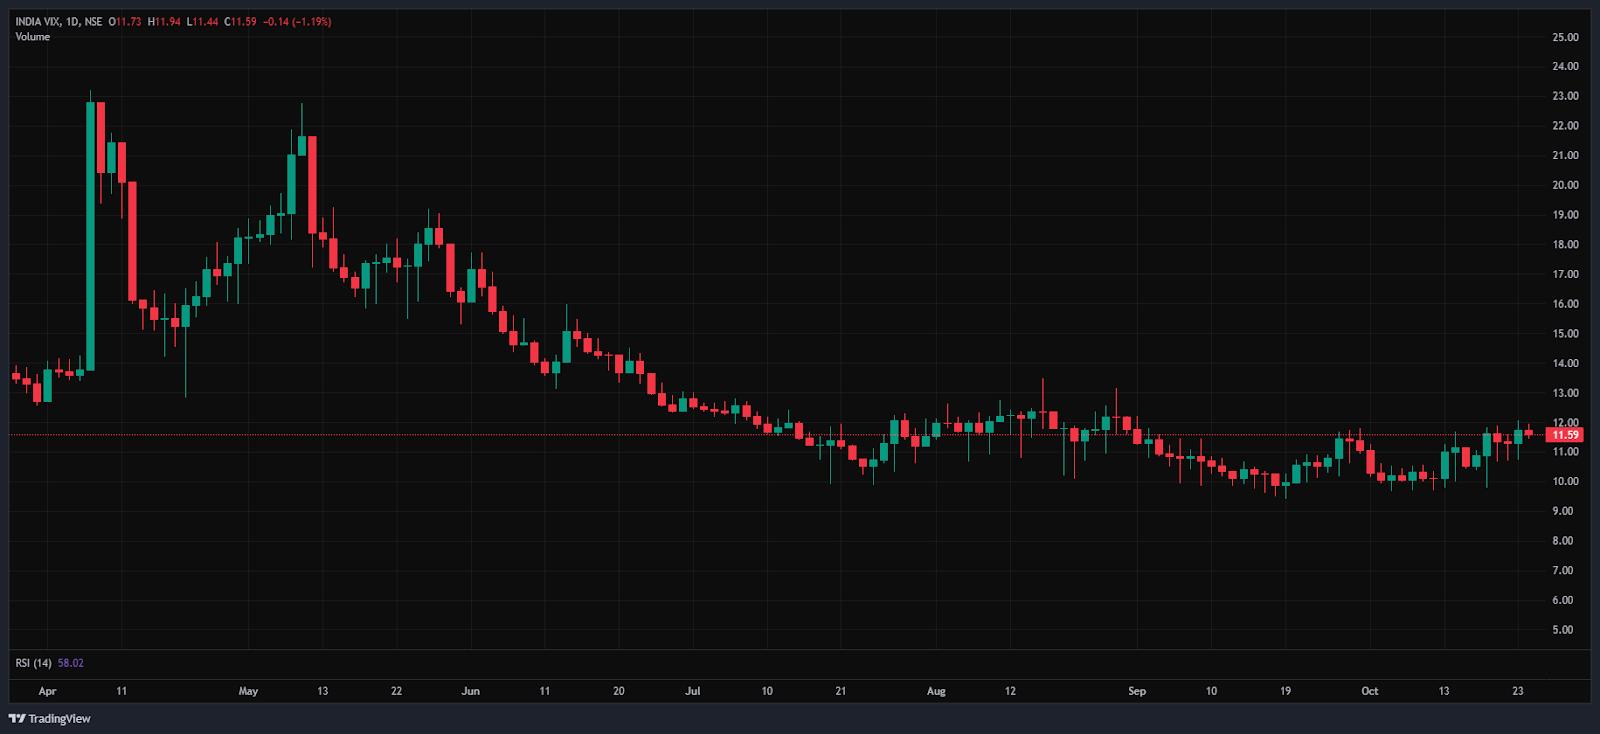
The India VIX decreased by 0.14 points or 1.21%, from 11.73 to 11.59 during Friday’s session. A decrease in the India VIX typically indicates lower price volatility in the stock market, suggesting a more stable market environment. However, a stable market environment and minimal volatility are anticipated when the India VIX is below 15.
Market Recap – 24th October 2025
On Friday, the Nifty 50 opened on a slightly positive note at 25,935.10, up 43.7 points from its previous close of 25,891.4. However, the index failed to sustain the early momentum and moved downward, hitting a day’s low of 25,718.20, hovering near the 25,700 level, before closing at 25,795.15, down 96.25 points, or -0.37%. The index remained above all key moving averages (20/50/100/200-day EMAs) on the daily chart, reflecting strong technical support.
The BSE Sensex mirrored the Nifty’s movement, opening at 84,667.23, up 110.83 points from its previous close of 84,556.40. Similar to the Nifty 50, the index declined through the session, touching a day’s low of 83,957.15, briefly breaching the 84,000 level, before settling at 84,211.88, down 344.52 points, or -0.41%. Both indices ended the week in red, with RSI values for the Nifty 50 at 67.92 and Sensex at 67.78, hovering near the overbought threshold of 70.
The Bank Nifty Index also closed in the negative territory, slipping -378.45 points, or -0.65%, to 57,699.60. The decline was primarily attributed to uncertainty surrounding the US-India trade deal and profit booking following the recent rally in the indices. Additionally, investors awaited the US CPI data scheduled for release later on Friday.
Most sectoral indices ended in the red on Friday, with only a few posting gains. The Nifty Metal Index emerged as the top gainer, advancing 1.03%, or 105.60 points, to 10,347.45. Stocks such as Hindalco Industries Ltd, Hindustan Copper Ltd, National Aluminium Company Ltd, and Vedanta Ltd climbed up to 4.04%. The Nifty Oil & Gas Index also posted gains, rising 0.20%, or 22.90 points, to 11,624.05, led by stocks like Oil & Natural Gas Corporation Ltd, Petronet LNG Ltd, GAIL (India) Ltd, and Oil India Ltd, which gained up to 1.05%.
The Nifty Realty Index too ended in green, closing at 940.90, up 0.18%, or 1.70 points. SignatureGlobal India Ltd rose 3.97%, while other realty counters such as Oberoi Realty Ltd, Prestige Estates Projects Ltd, and Godrej Properties Ltd advanced up to 1.55%.
The Nifty Health Index was the major laggard, declining -0.83%, or -123.80 points, to close at 14,862.85. Cipla Ltd registered the steepest fall of -3.69%, while other healthcare names like Max Healthcare Institute, Glenmark Pharma, and Apollo Hospitals slipped up to -2.22%. The Nifty Private Bank Index also dropped, ending at 28,335.25, down -231.85 points, or -0.81%, dragged by stocks such as Kotak Mahindra Bank Ltd, HDFC Bank Ltd, Axis Bank Ltd, and IDFC First Bank Ltd, which declined up to -1.73%. The Nifty FMCG Index also remained weak, closing at 56,348.10, losing -424.35 points, or -0.75%.
In contrast, Asian markets maintained an overall bullish sentiment on Friday. Japan’s Nikkei 225 surged 1.26%, or 618.39 points, to close at 49,260.00. Hong Kong’s Hang Seng gained 0.78%, or 203.02 points, to end at 26,171.00, while China’s Shanghai Composite rose 0.71%, or 27.90 points, to 3,950.31. South Korea’s KOSPI Index jumped 2.44%, or 96.03 points, finishing at 3,941.59. At 4:05 p.m. IST, U.S. Dow Jones Futures were up 0.15%, at 46,801.59, a rise of 63.99 points.
The broader indices concluded the week with modest gains, advancing 85.30 points, or 0.33%, to close near the 25,800 mark at 25,795.15. The Nifty 50 also touched a 52-week high of 26,104.20 during the week, successfully crossing the 26,000 level.
Trade Setup Summary
The Nifty 50 opened on a positive note at 25,935.10 on Friday but ended the session in the red below the 25,800 level at 25,795.15. A break below 25,728 could trigger further selling towards 25,576, while breaking the next resistance level of 25,913 could trigger bullishness towards the 26,101 level.
Bank Nifty also started the session on a positive note at 58,172.75 but ended the session in the red at 57,699.60, below the 57,700 level. A break below 57,484 could trigger further selling towards 57,274, while breaking the next resistance level of 57,903 could trigger bullishness towards the 58,272 level.
Sensex also opened on a positive note at 84,667.23 but ended the session in the red at 84,211.88, below the 84,300 level. A break below 83,961 could trigger further selling towards 83,533, while breaking the next resistance level of 84,570 could trigger bullishness towards the 84,885 level.
Given the ongoing volatility and mixed sentiments, it’s advisable to avoid aggressive positions and wait for clear directional moves above resistance or below support. Traders should consider these key support and resistance levels when entering long or short positions following the price break from these critical levels. Additionally, traders can combine moving averages to identify more accurate entry and exit points.
Disclaimer

The views and investment tips expressed by investment experts/broking houses/rating agencies on tradebrains.in are their own, and not that of the website or its management. Investing in equities poses a risk of financial losses. Investors must therefore exercise due caution while investing or trading in stocks. Trade Brains Technologies Private Limited or the author are not liable for any losses caused as a result of the decision based on this article. Please consult your investment advisor before investing.
About: Trade Brains Portal is a stock analysis platform. Its trade name is Dailyraven Technologies Private Limited, and its SEBI-registered research analyst registration number is INH000015729.
Investments in securities are subject to market risks. Read all the related documents carefully before investing.
Registration granted by SEBI and certification from NISM in no way guarantee performance of the intermediary or provide any assurance of returns to investors.
The post Technical View: Nifty, Bank Nifty & Sensex Trade Setup and Key levels to watch for 27th October appeared first on Trade Brains.