Indian equity markets showed a mixed but generally stable trend on Friday, with moderate momentum across sectors. Major indices opened higher but witnessed some profit booking and selling pressure, reflecting cautious investor sentiment amid mixed global cues. While certain sectors like autos, pharmaceuticals, and media saw notable gains, oil & gas, capital markets, and PSE stocks faced pressure, highlighting a divergence in sectoral performance.
Over the week, broader markets recorded modest gains, hitting fresh all-time highs, supported by easing inflation, stable liquidity, and robust macroeconomic conditions. Investor focus remains on the upcoming RBI monetary policy meeting, where expectations of a repo rate cut are driving sentiment and positioning for the near term.
In this overview, we will analyse the key technical levels and trend directions for Nifty and BSE Sensex to monitor in the upcoming trading sessions. All the charts mentioned below are based on the 15-minute timeframe.
NIFTY 50 Chart & Price Action Analysis
To view other technical reports, click here
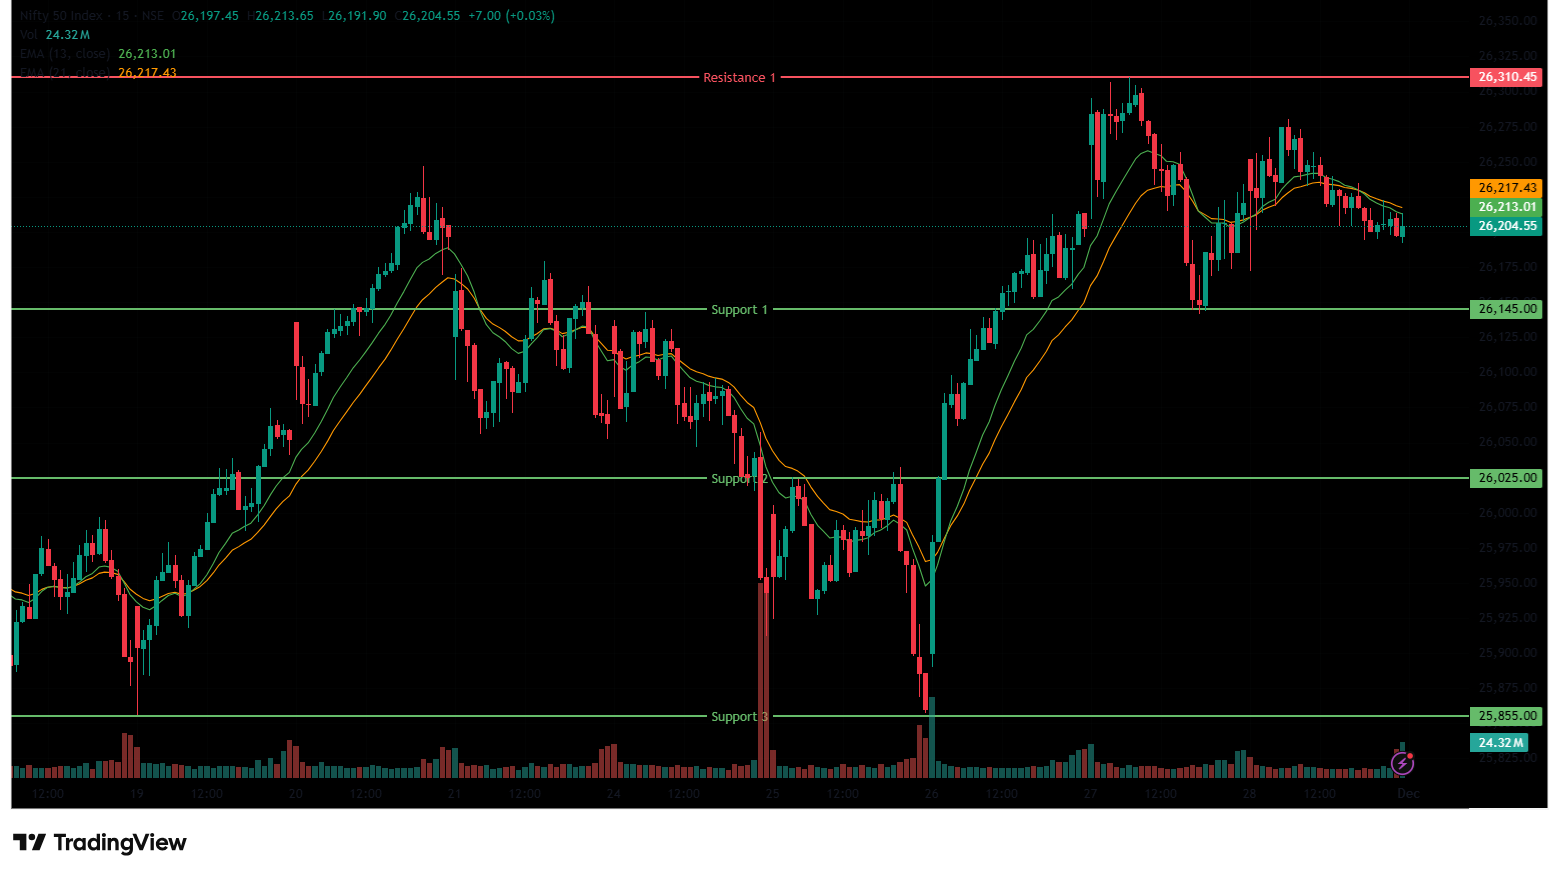
The Nifty 50 Index opened on a positive note at 26,237.45 on Friday, up by 21.9 points from Thursday’s closing of 26,215.55. The index opened on an optimistic note and hit the day’s high at 26,280.75 during the morning session and was trading within the range of 26,170 and 26,281.
In the afternoon session, the index lost its momentum and dropped but remained above the 26,200 level. The Index was trading between the range of 26,190 and 26,240. Finally, it had closed on a flat to negative note at 26,202.95, down by 12.60 points, or 0.048%. In the short term, the Index was above the 13/20-day EMA, indicating a near-term bullish trend in the daily time frame.
The Nifty 50’s nearest resistance level is at 26,310.45 (R1), which is the all-time high for the index. On the other hand, the closest support is now at 26,145 (S1), and the next one at 26,025 (S2), which were previous resistances now acting as support. If the index falls below this, the next strong support level to watch is at 25,855 (S3).
Trade Setup:
| Nifty 50 | |
| Resistance 1 | 26,310.45 |
| Closing Price | 26,202.95 |
| Support 1 | 26,145.00 |
| Support 2 | 26,025.00 |
| Support 3 | 25,855.00 |
NIFTY 50 Momentum Indicators Analysis
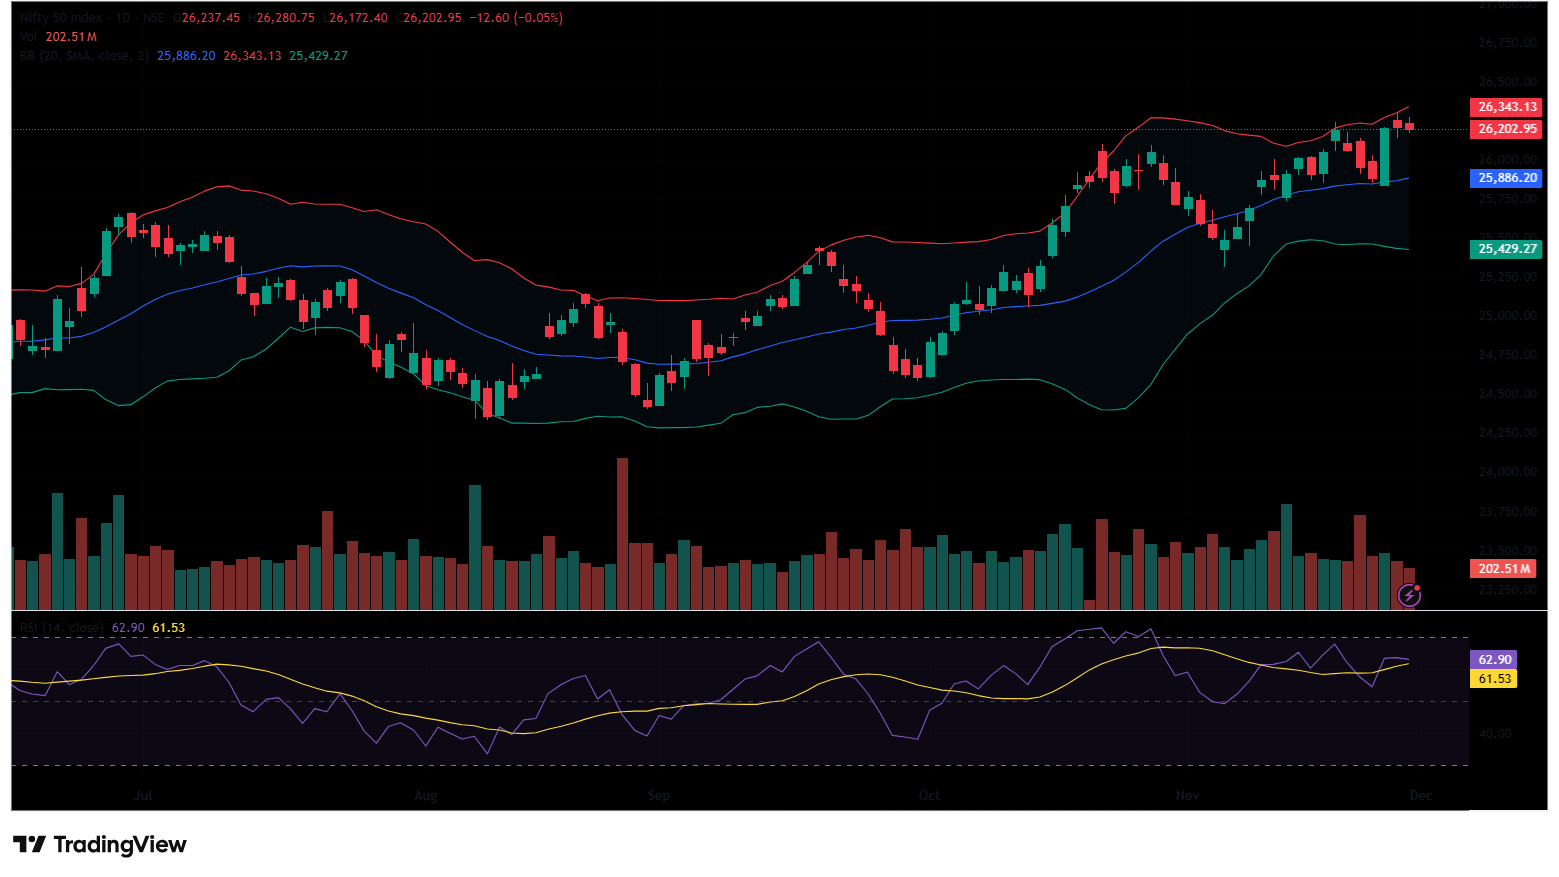
RSI (Daily): The Nifty 50’s RSI stood at 62.9, which is below the overbought zone of 70, indicating room to grow higher.
Bollinger Bands (Daily): The index is comfortably trading in the upper band of the Bollinger Band range. Its position in the upper range suggests a bullish sentiment in the short term. However, on Friday’s session, the Index formed a bearish candlestick pattern, which has small wicks on both sides, indicating indecisiveness. The index sustained above the 26,200 level for the second consecutive session. A sustained move above the middle band signals a bullish sentiment, while a drop back toward the lower band may reinforce bearish sentiment.
Volume Analysis: Friday’s trading session had an average volume of 202.51 Mn.
Derivatives Data: Options open interest (OI) data suggest a strong support zone around 26,100 and 26,200, where put option writing is high, indicating traders expect the index to hold these levels. On the upside, significant call option open interest at 26,300 and 26,400 signals resistance, as sellers are likely to defend these strike prices. The Put/Call Ratio (PCR) stands at 1.12, which is above 1 and indicates a neutral to bearish sentiment with more put activity than call. However, the presence of a short covering, where traders are involved in buying shares to close out a short position, which increases demand and drives up the price, adds buying pressure, making the overall outlook mixed. This combination implies the market may trade in a range, with strong support near 26,100-26,200 and resistance near 26,300-26,400, until a decisive breakout occurs.
Bank Nifty Chart & Price Action Analysis
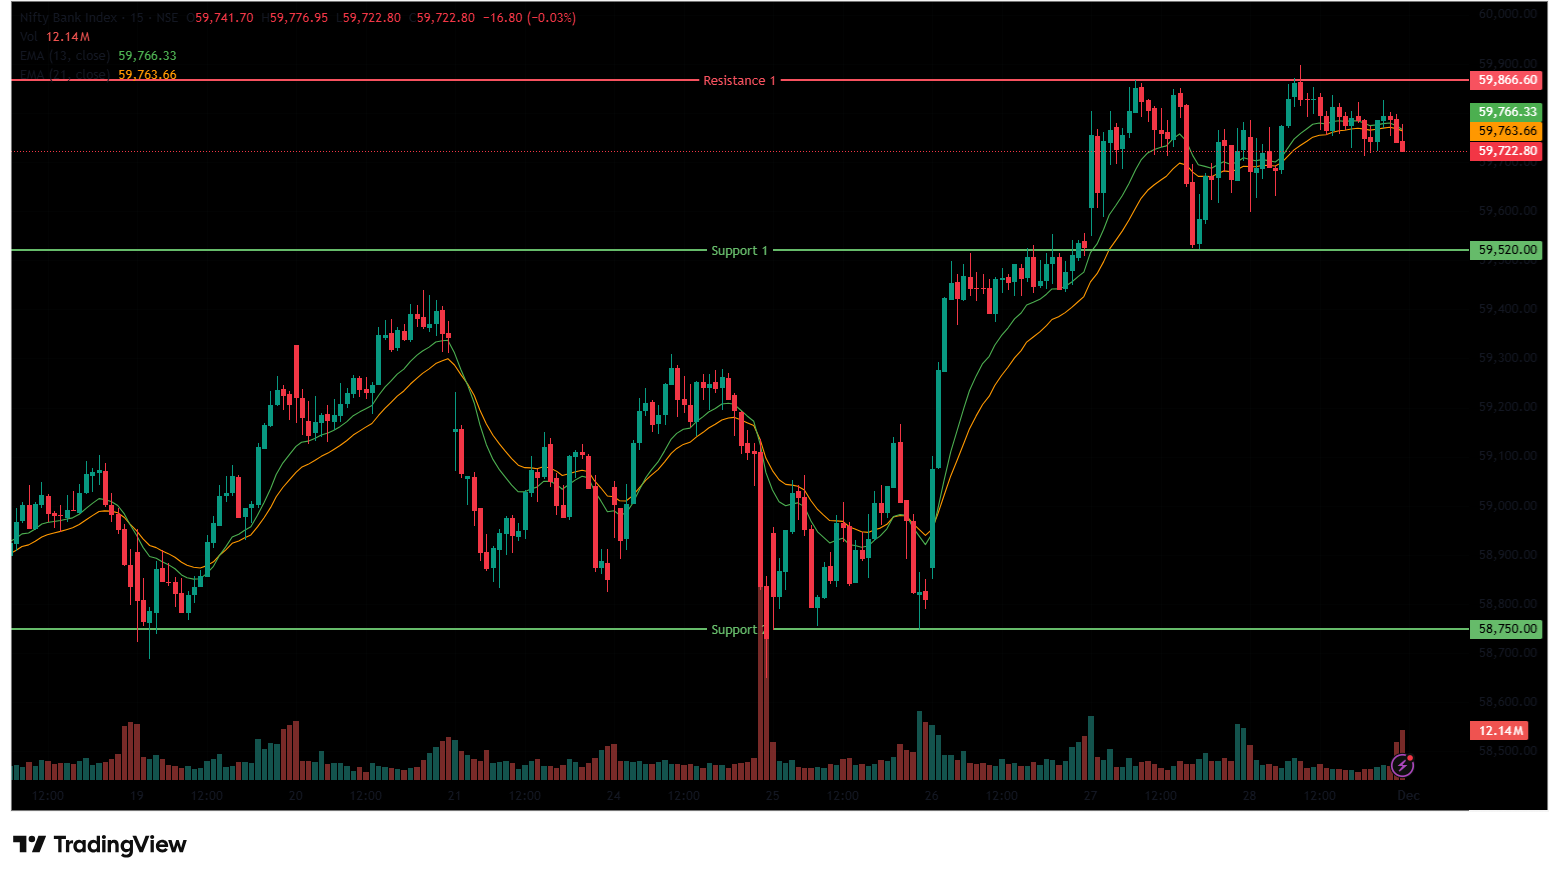
The Bank Nifty Index also opened on a flat to positive note at 59,758.70, above the 59,750 level, on Friday, up by 21.4 points from Thursday’s closing of 59,737.30. During the morning session, the index moved upwards above 59,850, hitting a new all-time high of 59,897.50. But later the index fell to the 59,750 level, and it was trading in a range between the 59,600 and 59,900 levels.
In the afternoon session, the index continued to trade in a range-bound manner and was trading in the range of 59,700 and 59,830, ending the day near the 59,750 mark. Finally, it had closed on a flat note at 59,752.70, up by 15.4 points or 0.026%. The Relative Strength Index (RSI) stood at 72.18, in the overbought zone of 70 in the daily time frame. In the short term, the Index was above the 13/20 day EMA in the daily time frame.
The nearest resistance is at 59,866.60 (R1), which is the all-time high for the index. On the other hand, the closest support is now at 59,520 (S1), and the next support is at 58,750 (S2), where the index has taken support at this level previously.
Trade Setup:
| Bank Nifty | |
| Resistance 1 | 59,866.60 |
| Closing Price | 59,752.70 |
| Support 1 | 59,520.00 |
| Support 2 | 58,750.00 |
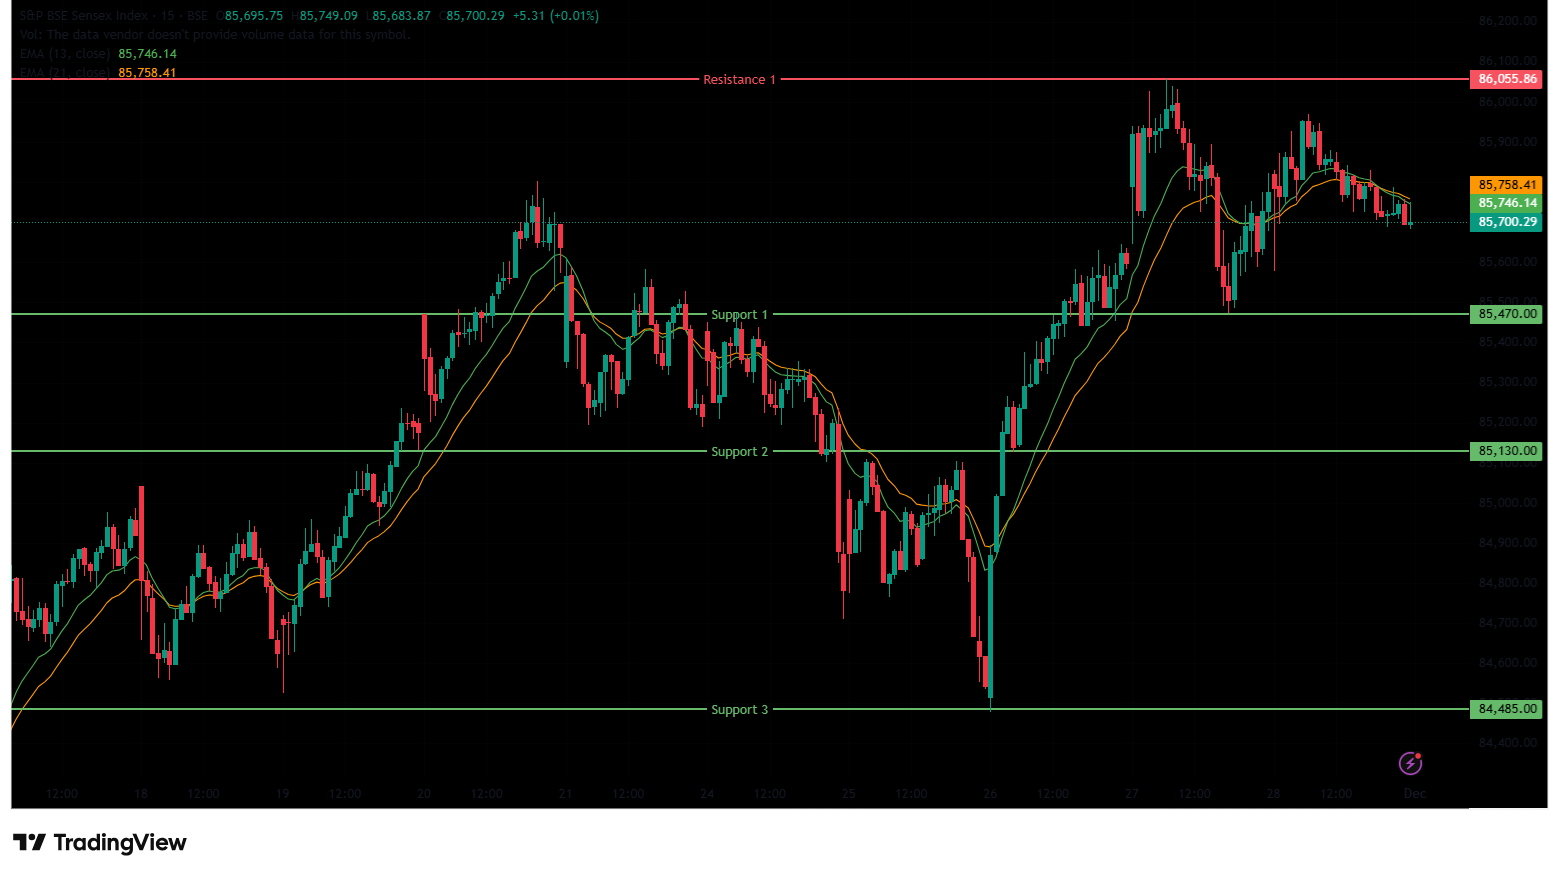
BSE Sensex Chart & Price Action Analysis
To view other technical reports, click here
The BSE Sensex Index also opened on a similar note as the Nifty 50, opening at 85,791.55 on Friday, up by 71.17 points from Thursday’s closing of 85,720.38. The Sensex index opened on a positive note and hit the day’s high at 85,969.89 during the morning session. It traded in the range of 85,570 and 85,970 during the morning session. In the afternoon session, the index started declining from its high and reached the 85,700 mark.
The Index was trading between the range of 85,680 and 85,850 during the afternoon session. Finally, it had closed at 85,706.67 in red, down 13.71 points or 0.016%. The Relative Strength Index (RSI) stood at 64.15, below the overbought zone of 70 in the daily time frame. In the short term, the Index was above the 13/20 day EMA in the daily time frame, and the index formed a bearish candlestick pattern with small wicks on both sides, which suggests indecisiveness.
The index faces immediate resistance at 86,055.86 (R1), a level near its all-time high. On the downside, support lies at 85,470 (S1), which was previously resistance and now acts as support; the next one is at 85,130 (S2), where the index has taken support previously. Whereas the next support level (S3) is at 84,485.
Trade Setup:
| Sensex | |
| Resistance 1 | 86,055.86 |
| Closing Price | 85,706.67 |
| Support 1 | 85,470.00 |
| Support 2 | 85,130.00 |
| Support 3 | 84,485.00 |
Market Recap on November 28th, 2025
On Friday, the Nifty 50 opened slightly higher at 26,237.45, up by 21.9 points from its previous close of 26,215.55. The index hit an intraday high of 26,280.75 and closed above the 26,200 level at 26,202.95, down -12.6 points, or 0.048%. The index closed above all key moving averages (20/50/100/200-day EMAs) on the daily chart. The BSE Sensex followed the same trajectory, opening on a positive trend at 85,791.55, up 71.17 points from the previous close of 85,720.38.
It closed at 85,706.67, down -13.71 points, or 0.016%. Both indices showed moderate momentum, with RSI values for the Nifty 50 at 62.9 and the Sensex at 64.15, nearing the overbought threshold of 70. The broad indices witnessed a fall due to mixed global cues, continued FIIs selling equities worth Rs 1,255 crore on Thursday, and profit booking by investors.
On Friday, major gainers were the Nifty Auto index, which rose 0.6% or 170.95 points and stood at 27,774.6. Stocks such as Mahindra & Mahindra Ltd rose 2.1%, followed by Exide Industries Ltd and Eicher Motors Ltd, which increased by up to 1.8% on Friday. The Nifty Pharma index was also among the biggest gainers, increasing 0.6% or 135.3 points, and standing at 22,998.30. Stocks such as Ipca Laboratories Ltd, Laurus Labs Ltd, Abbott India Ltd, and Ajanta Pharma Ltd all rose by up to 2.8% on Friday. The Nifty Media index also rose by 0.6% or 8.05 points, to 1,468.25.
On the other hand, the Nifty Oil & Gas index was the major loser, falling -0.7% or -83.85 points, and standing at 12,034.40. Stocks such as GAIL Ltd fell by -4.2%, followed by Gujarat State Petronet Ltd and Bharat Petroleum Ltd, which decreased by up to -1.5% on Friday. The Nifty Capital Markets index was also among the biggest losers, falling -0.7% or -33.35 points, and standing at 4,782.10. Stocks such as MCX of India Ltd were down -3.4% on Friday. While other stocks like Angel One Ltd, Indian Energy Exchange, and BSE Ltd also decreased by up to -2.2%. The Nifty PSE index was also among the top losers, falling -0.7% or -63.7 points, and standing at 9,744.30.
Asian markets ended the week on a mixed note. China’s Shanghai Composite increased by 13.34 points, or 0.34%, to 3,888.60; Japan’s Nikkei 225 rose by 52.9 points or 0.11%, closing at 50,220. Whereas, Hong Kong’s Hang Seng Index decreased by -30.93 points, or -0.12%, to close at 25,915, and South Korea’s KOSPI also declined by -60.32 points or -1.54%, closing at 3,926.59.
This week, the broad indices Nifty 50 and Sensex rose by 0.52% and 0.56% respectively. The broader indices also hit a fresh all-time high, with the Nifty 50 crossing above 26,300 and peaking at 26,310.45; meanwhile, Sensex hit an all-time high at 86,055.86. With inflation easing, liquidity steady, and macroeconomic conditions strong, investors expect the RBI to cut the repo rate by 25 bps to 5.25%. The MPC meeting is dated from December 3-5, with the policy decision to be announced on December 5.
India VIX
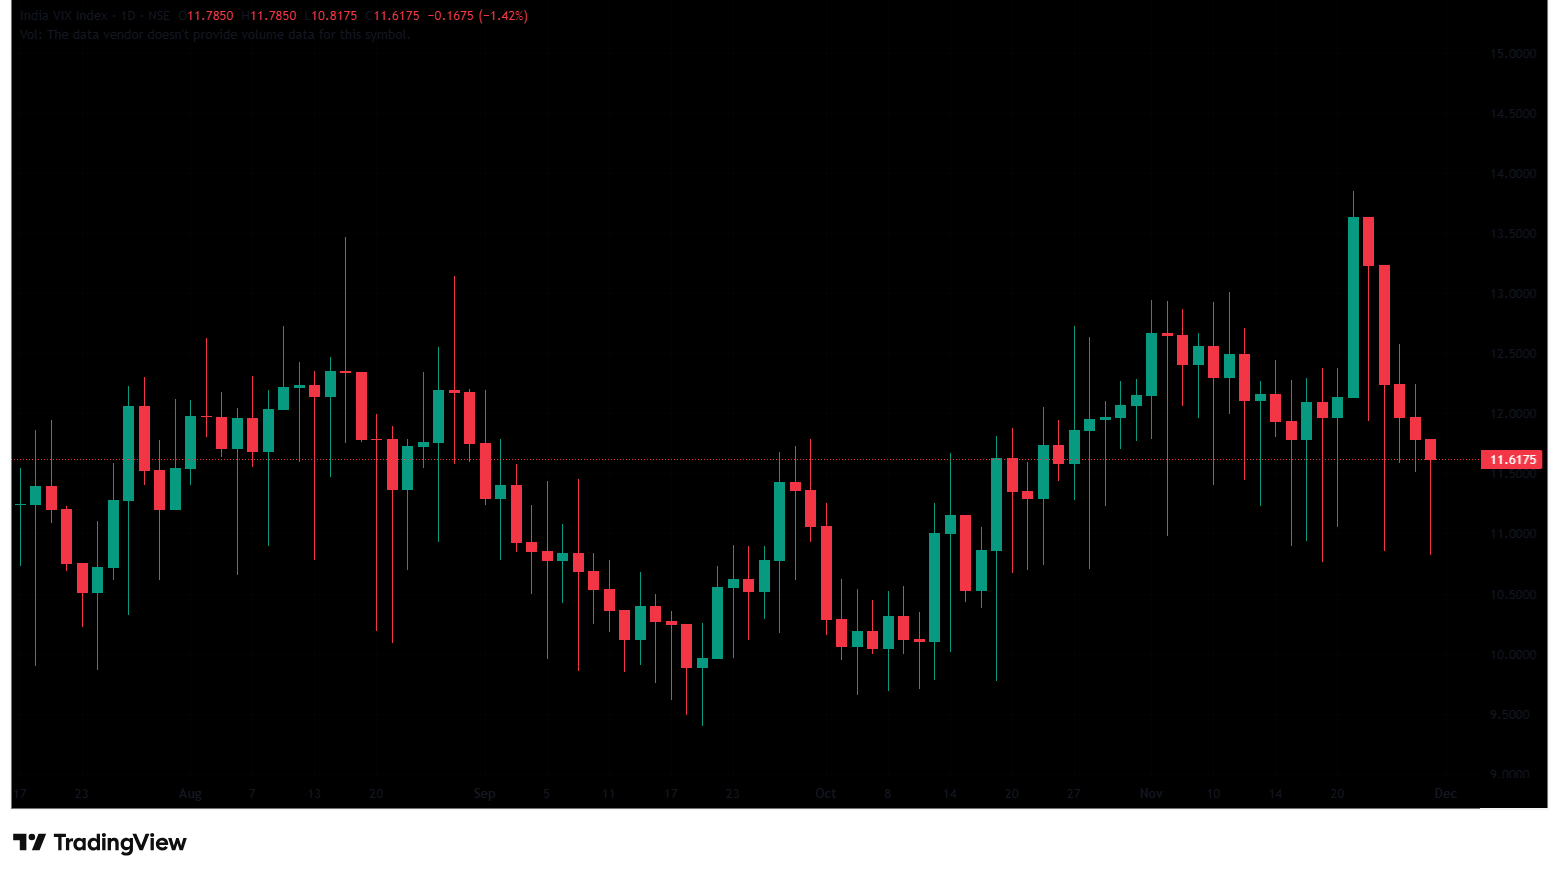
The India VIX fell 0.17 points (1.44%) from 11.79 to 11.62 during Friday’s session, indicating a downtrend in expected market volatility. However, overall volatility remains low, since the India VIX is generally considered elevated only when it rises above 15.
Given the ongoing volatility and mixed sentiments, it’s advisable to avoid aggressive positions and wait for clear directional moves above resistance or below support. Traders should consider these key support and resistance levels when entering long or short positions following the price break from these critical levels. Additionally, traders can combine moving averages to identify more accurate entry and exit points.
Disclaimer

The views and investment tips expressed by investment experts/broking houses/rating agencies on tradebrains.in are their own, and not that of the website or its management. Investing in equities poses a risk of financial losses. Investors must therefore exercise due caution while investing or trading in stocks. Trade Brains Technologies Private Limited or the author are not liable for any losses caused as a result of the decision based on this article. Please consult your investment advisor before investing.
About: Trade Brains Portal is a stock analysis platform. Its trade name is Dailyraven Technologies Private Limited, and its SEBI-registered research analyst registration number is INH000015729.
Investments in securities are subject to market risks. Read all the related documents carefully before investing.
Registration granted by SEBI and certification from NISM in no way guarantee performance of the intermediary or provide any assurance of returns to investors.
The post Technical View: Nifty, Bank Nifty & Sensex Trade Setup and Key levels to watch for 1st December appeared first on Trade Brains.