
Synopsis: State Bank of India (SBI) displays a bearish reversal pattern on its 1-hour chart through a head and shoulders setup, indicating potential near-term downside momentum.
State Bank of India, following a sustained uptrend across recent sessions, has developed a head-and-shoulders pattern on its 1-hour chart, indicating a possible bearish reversal.
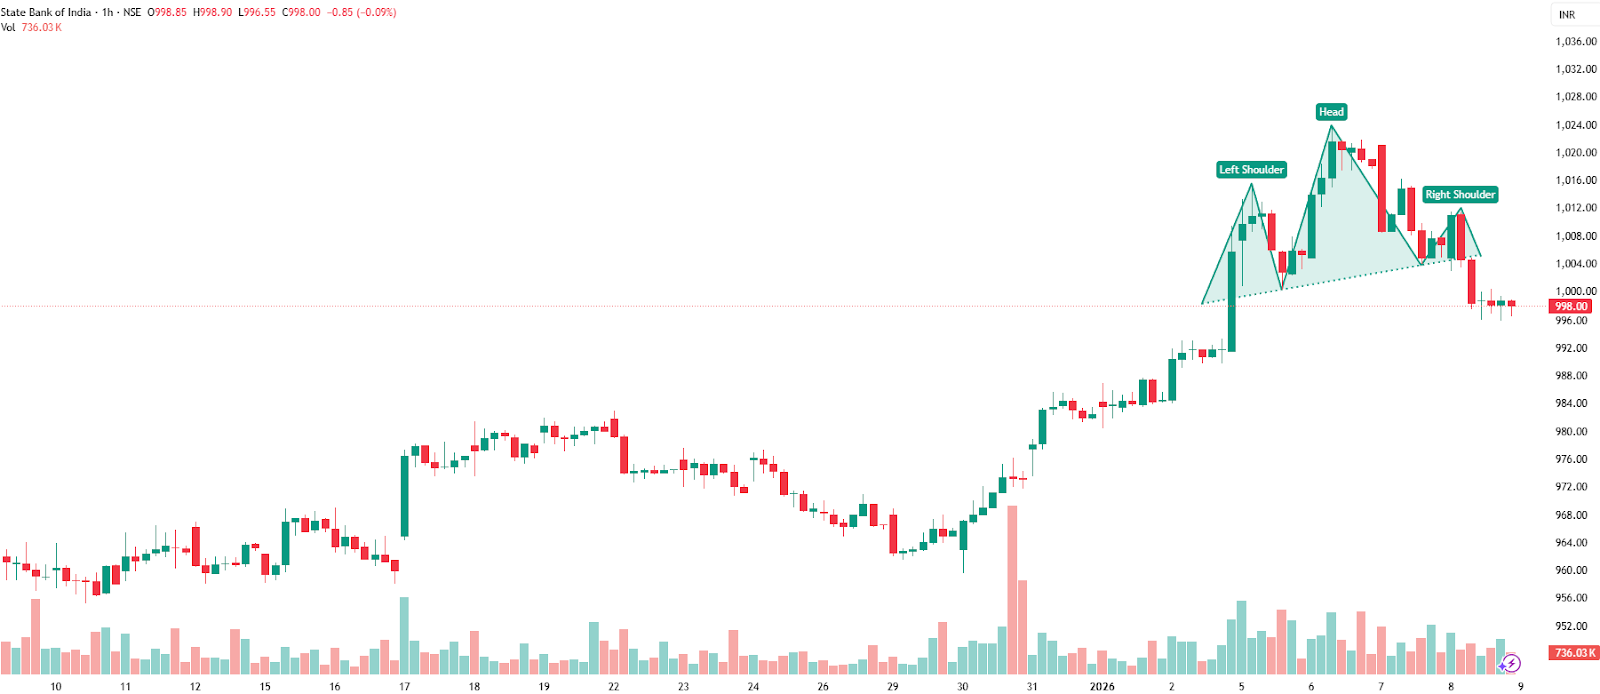
(1-Hour Timeframe)
The head-and-shoulders pattern represents a classic bearish reversal, characterised by a higher central peak (head) positioned between two lower peaks (shoulders). This structure indicates a potential transition from bullish to bearish momentum upon neckline breach.
On Thursday, State Bank of India (SBIN) established a lower-high formation across the head and shoulders before decisively breaking below the Rs 1,002 neckline. This breach, coupled with marginally reduced buying volumes, confirms the emergence of bearish momentum in the near term.
The downside target for the head-and-shoulders pattern is derived by measuring the vertical distance from the head’s peak to the neckline, then projecting that same distance downward from the breakdown point. Traders commonly use this projection to set profit targets. Upon nearing this level, positions are often partially or fully closed to lock in gains or reevaluate amid potential support reactions.
Indicator Confirmation
- RSI: The daily RSI shows persistent bearish momentum, as it dropped from 65 in the last trading session to 60 on Thursday, confirming the continuation of the downtrend.
- MACD: The orange signal line crossed above the Blue MACD line, with the histogram turning red, indicating bearish momentum.
- Moving Averages: On the 1-hour time frame, the 5-day moving average has crossed below the 9-day moving average, further confirming a bearish trend.
- Price Volume Trend: The Price Volume Indicator confirms the trend, supported by a sharp decline in trading volume.
Implications
The bearish head-and-shoulders breakdown signals potential for extended downside. A decisive close below the neckline support, preferably with elevated volume, to mitigate false breakout risks. Upside resistance looms at Rs 1,002, while persistent trading below the breakdown zone reinforces bearish control.
About the stock
State Bank of India (SBI), India’s public sector bank, incorporated in 1955, manages over 23.05K branches, 62,500 ATMs, and 78,933 BC outlets, commanding more than 22% of domestic deposits. It dominates retail (home/auto loans), SME, agriculture, and corporate segments in infrastructure/services, with global operations in 29 countries, emphasising trade finance and GIFT City.
In the past month, State Bank of India posted a 4.31% return amid an extended uptrend. Over the prior six months, the stock advanced 22.76%, while achieving a 29.37% gain across the last year.
For more such technical stock ideas, Click here to view our research page.
Disclaimer: The views and investment tips expressed by investment experts/broking houses/rating agencies on tradebrains.in are their own, and not that of the website or its management. Investing in equities poses a risk of financial losses. Investors must therefore exercise due caution while investing or trading in stocks. Trade Brains Technologies Private Limited or the author are not liable for any losses caused as a result of the decision based on this article. Please consult your investment advisor before investing.
The post SBI Stock Shows Bearish Signs After Head & Shoulders Pattern Formation; Check the details appeared first on Trade Brains.