This is a daily analysis by CoinDesk analyst and Chartered Market Technician Omkar Godbole.
Bitcoin (BTC) has breached key support levels in a sign of increasing bearish momentum that suggests a risk of a slide to $100,000.
The leading cryptocurrency by market value fell 6.5% in August, ending the four-month winning streak as the U.S.-listed spot exchange-traded funds (ETFs) bled $751 million, according to data source SoSoValue.
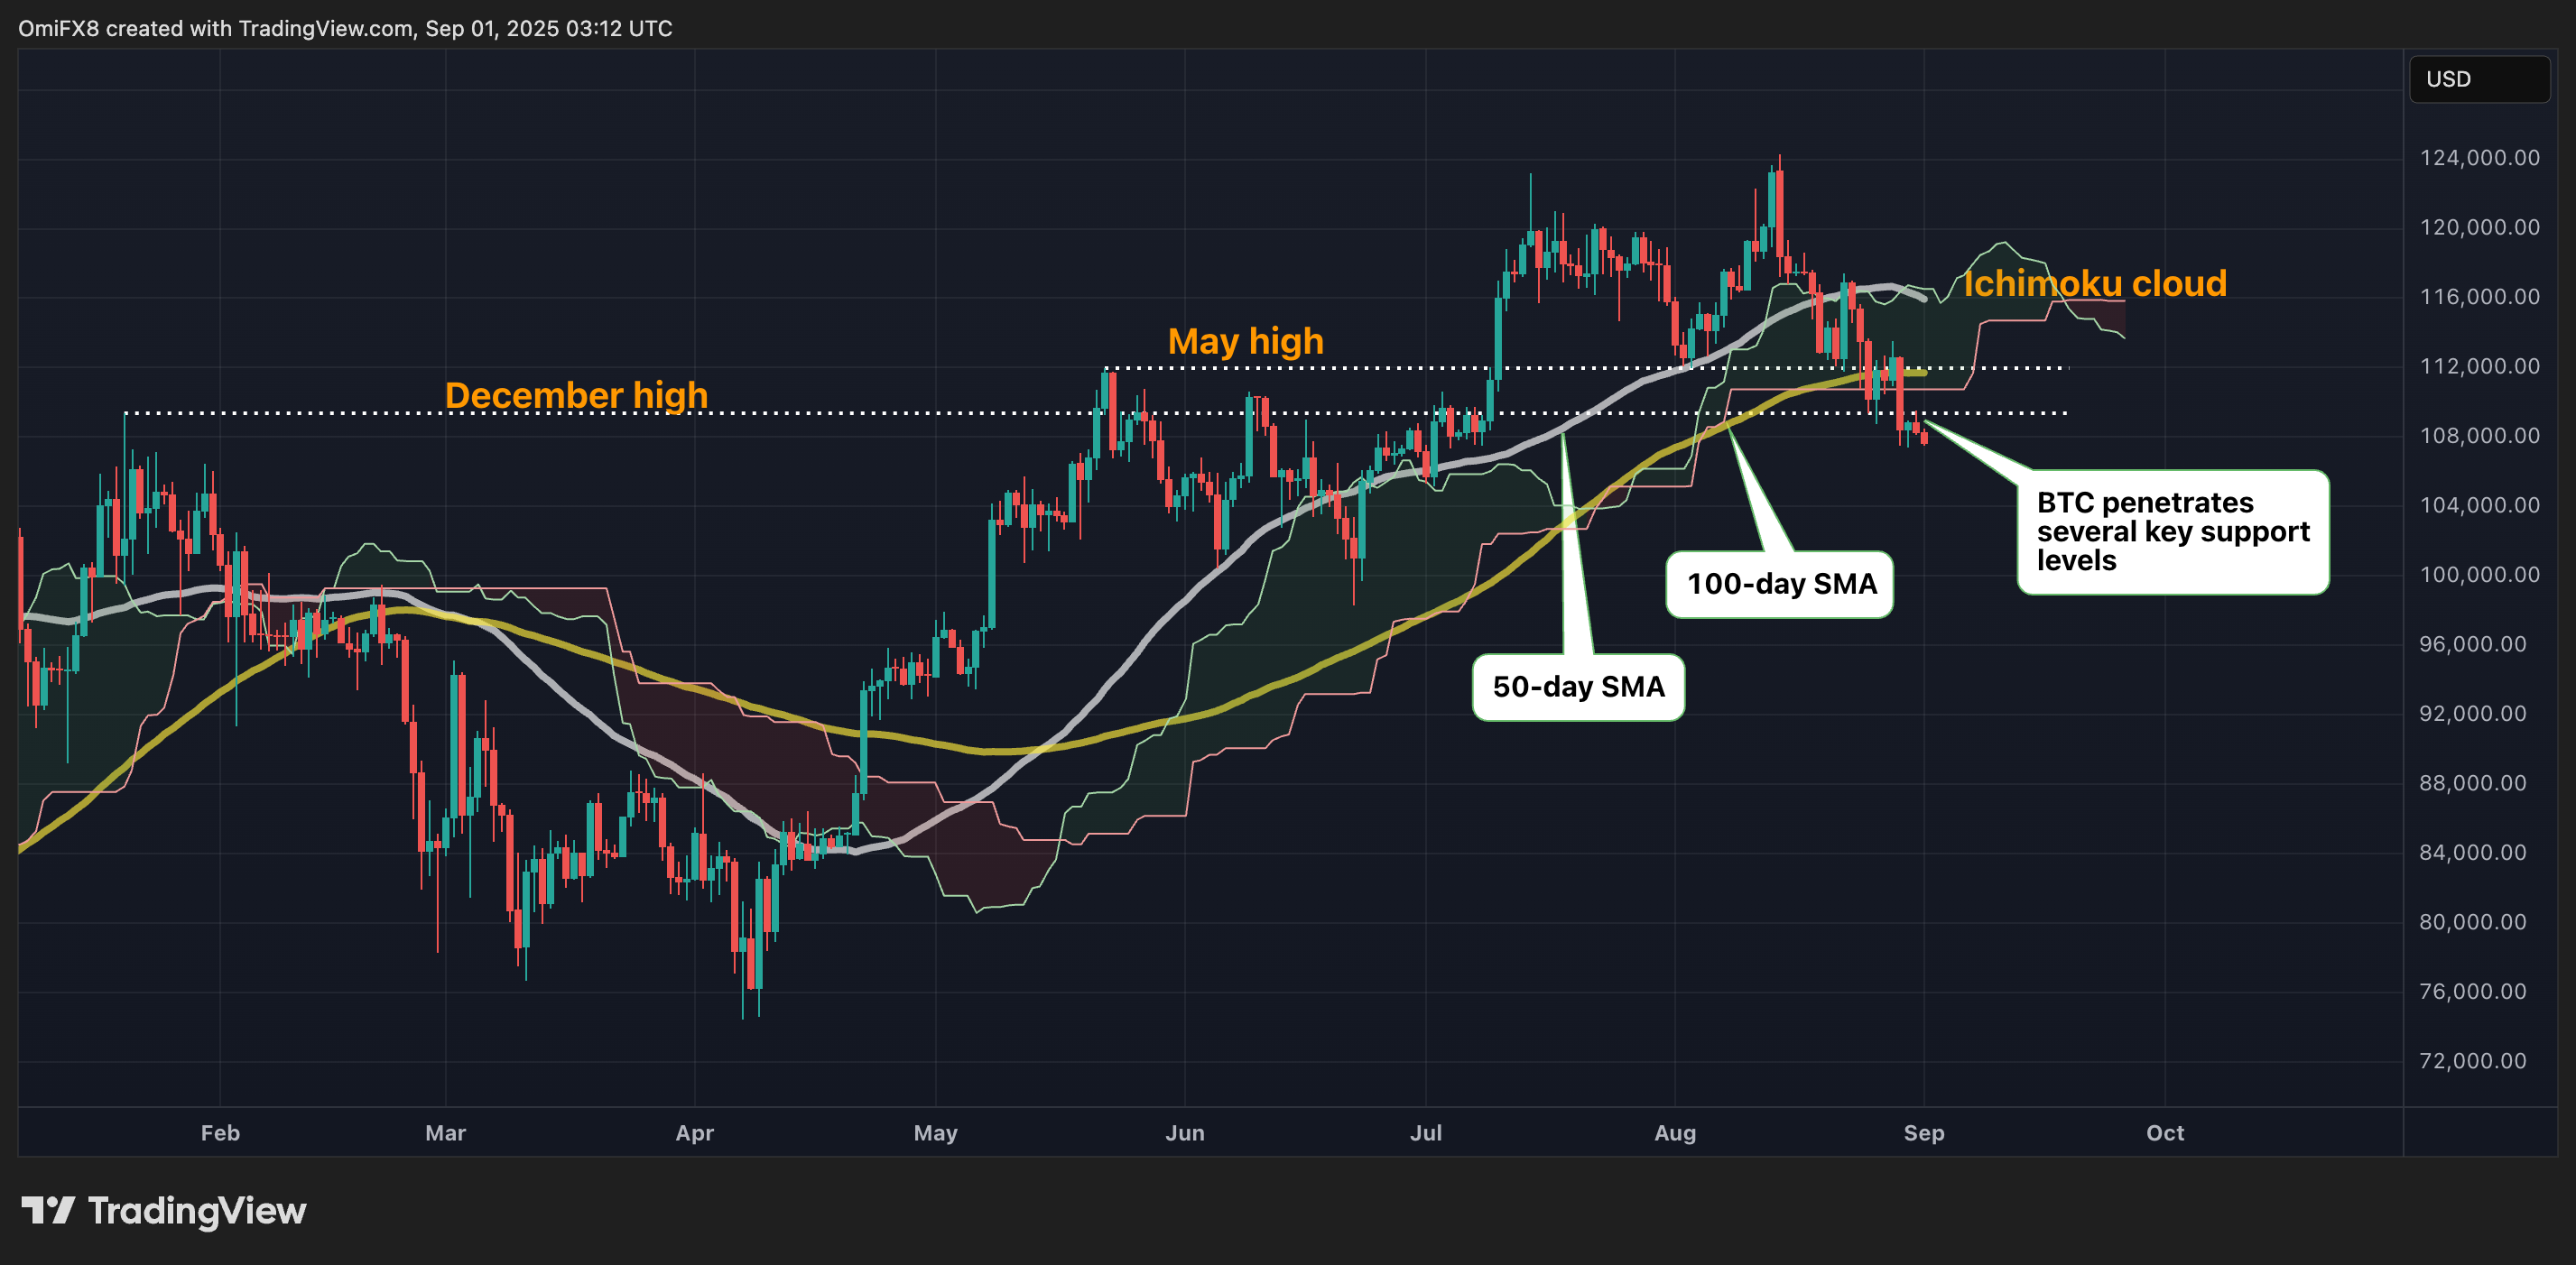
The recent price drop saw bitcoin break below several key support levels, including the Ichimoku cloud, and the 50-day and 100-day simple moving averages (SMAs). It also pierced crucial horizontal support zones formed by the May high of $111,965 and the December high of $109,364, according to the daily chart sourced from TradingView.

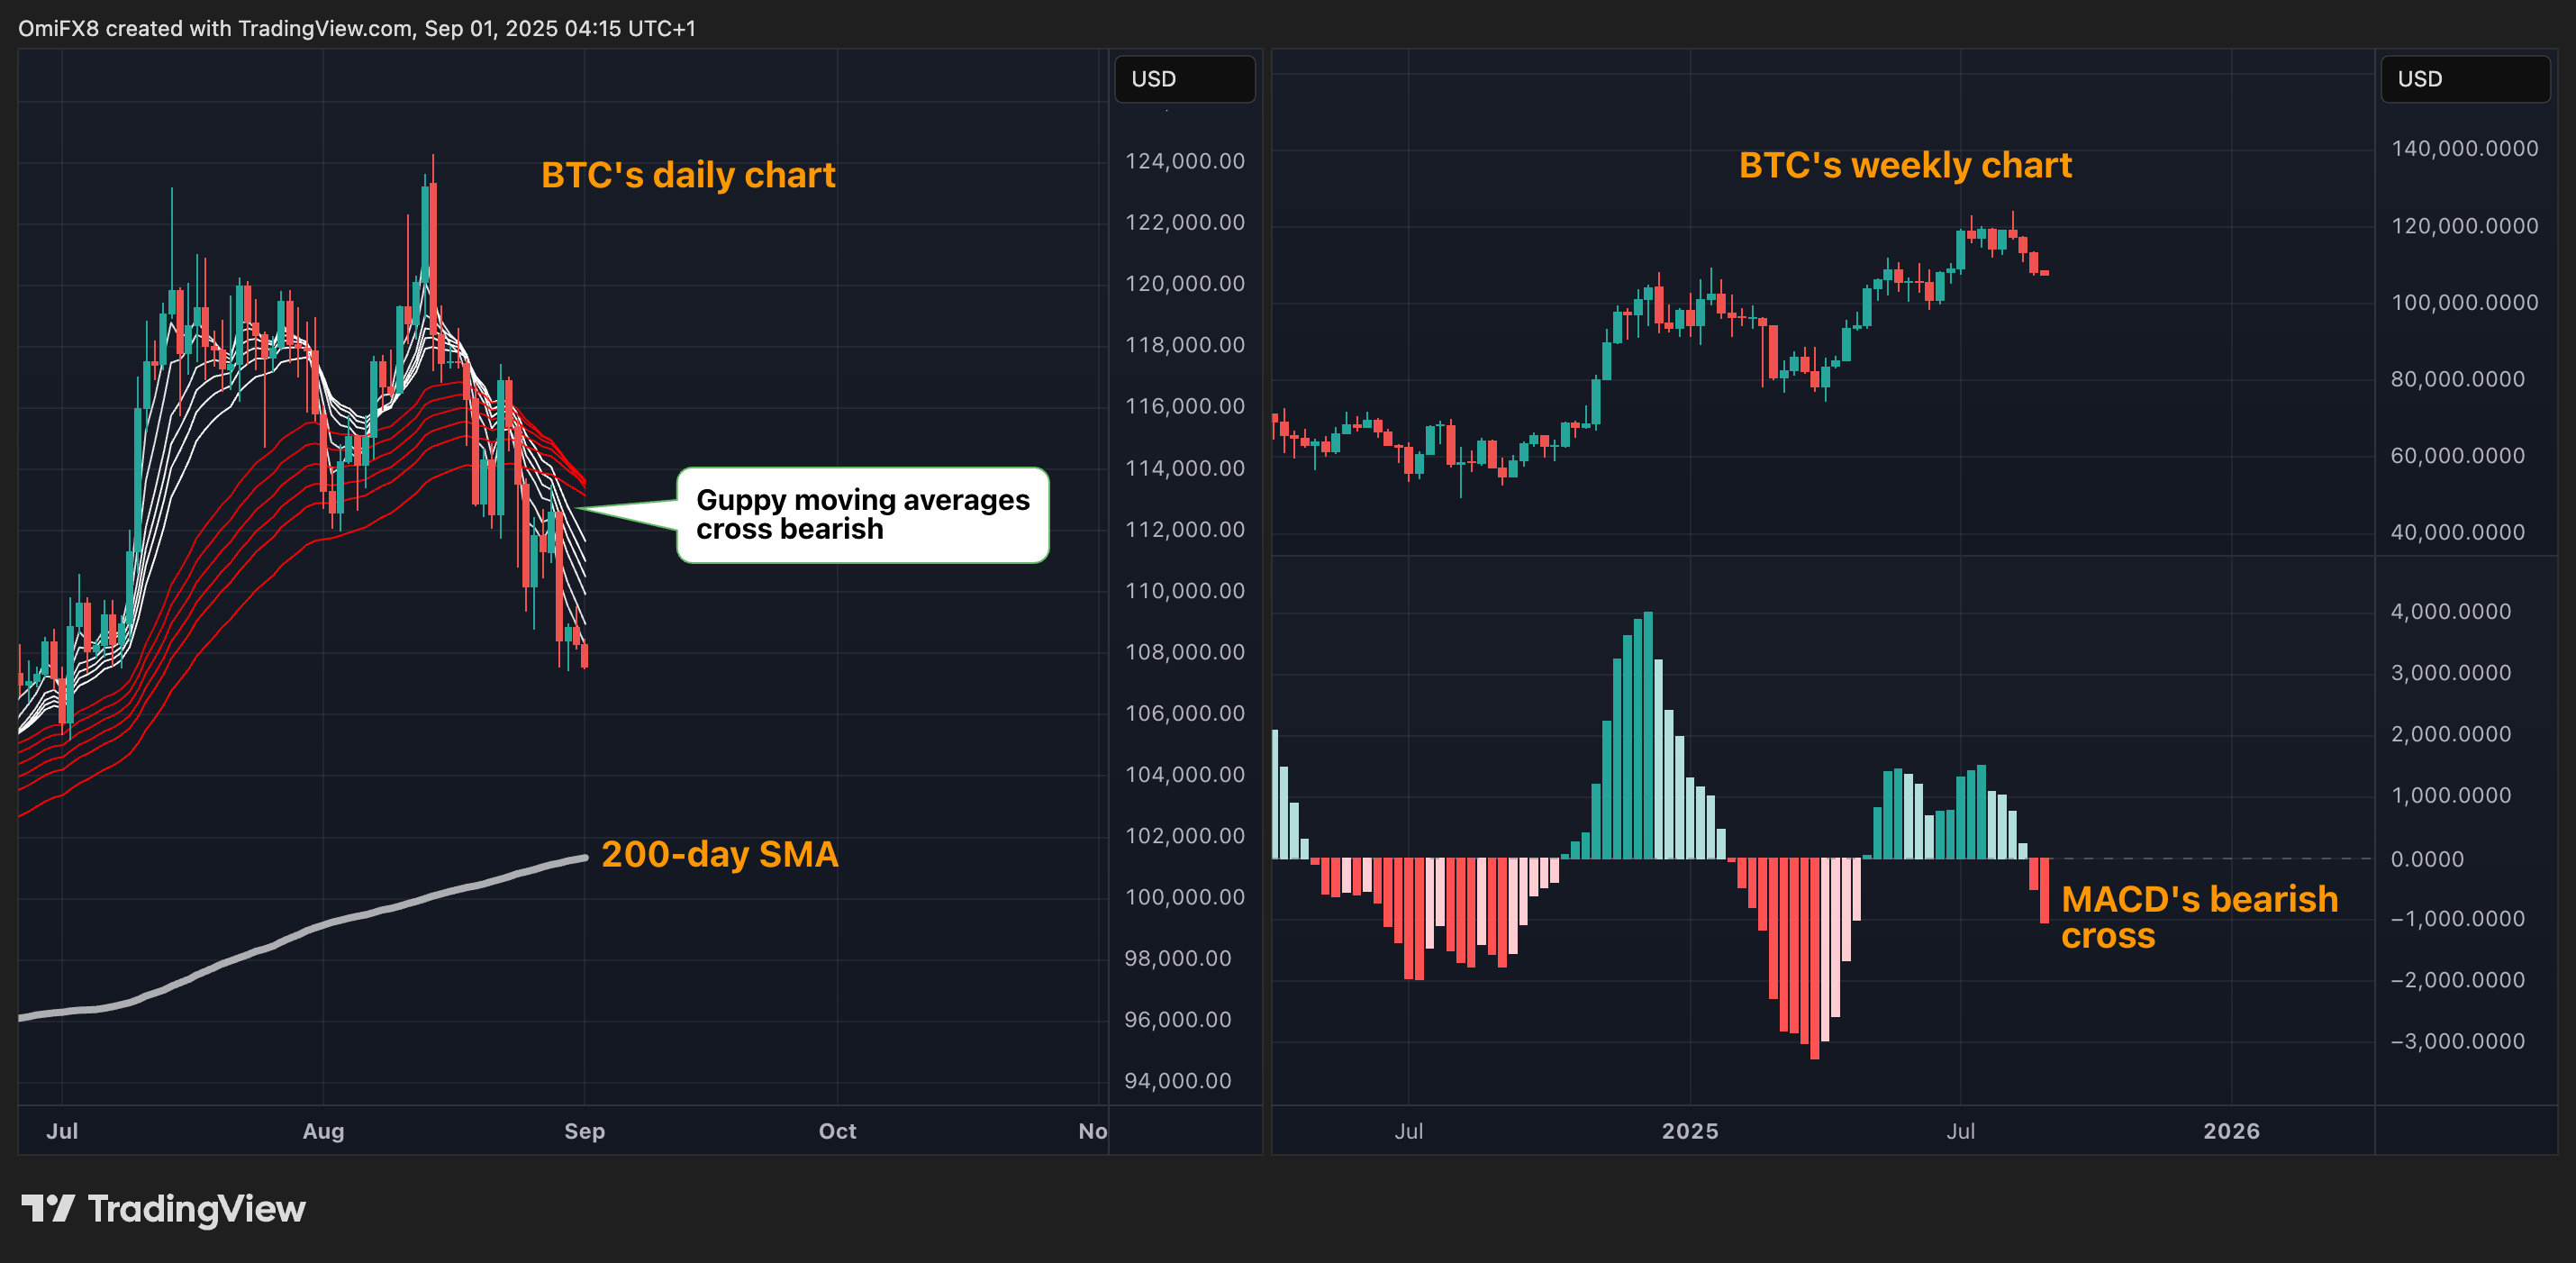
These breakdowns underscore growing market weakness, confirming a bearish shift in key momentum indicators such as the Guppy Multiple Moving Average (GMMA) and the MACD histogram.
The short-term exponential moving average (EMA) band of the GMMA (green) has crossed below the longer-term band (red), signaling a clear bearish momentum shift. Meanwhile, the weekly MACD histogram has dropped below zero, indicating a transition from a bullish to a bearish trend.
Together, these signals indicate a likelihood of a sustained sell-off, potentially driving the price down to the 200-day simple moving average (SMA) at $101,366, and possibly to the $100,000 mark.
The negative technical outlook aligns with seasonal trends, which show September historically as a bearish month for bitcoin. Since 2013, BTC has delivered an average return of -3.49%, closing lower in eight of the past 12 September months, according to data from Coinglass.
As for bulls, overcoming the lower high of $113,510 set on Aug. 28 is crucial to negating the bearish outlook.

- Support: $105,240 (the 38.2% Fib retracement of the April-August rally), $101,366 (the 200-day SMA), $100,000.
- Resistance: $110,756 (the lower end of the Ichimoku cloud), $113,510 (the lower high), $115,938 (the 50-day SMA).
