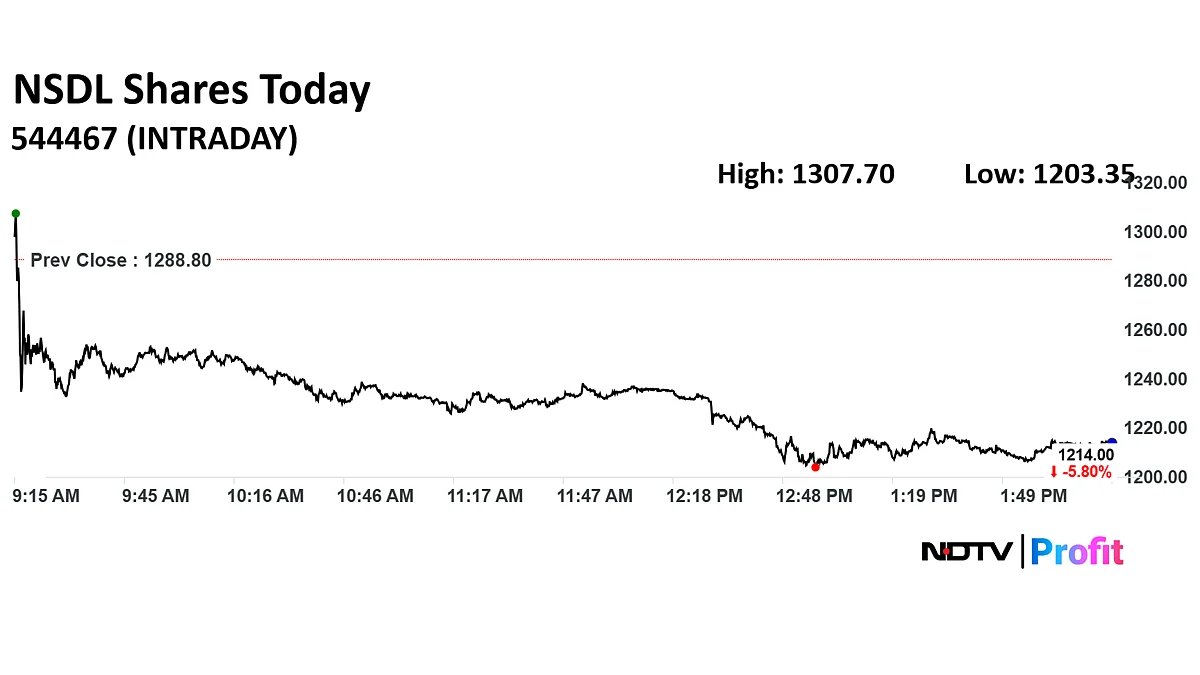
NSDL Versus CDSL: National Securities Depository Ltd. and Central Depository Services (India) Ltd. are the only two depositories in India. Both companies have announced their first-quarter financial results. Here’s a quick comparison between NSDL and CDSL Q1 performance.
NSDL Q1
NSDL‘s consolidated revenue decreased 14% sequentially for the three months ended June, reaching Rs 312 crore. Depository revenue fell 3% QoQ but rose 19% year-on-year. Lower expenses allowed net profit to grow 8% to Rs 89.6 crore, as against Rs 83.3 crore in the preceding quarter.
Operating income, or earnings before interest, taxes, depreciation, and amortisation, rose 4% quarter-on-quarter to Rs 95.2 crore. The Ebitda margin expanded to 30.5% from 25.1% in the previous quarter.
Demat account market share increased from 9.4% Q1 of last year to 15.5% in Q1 of fiscal 2026 and crossed the four crore-mark. NSDL has 86.6% market share by total demat custody value.

CDSL Q1
CDSL’s consolidated revenue jumped 15.6% to Rs 259 crore. The revenue growth was led by uptick in issuer revenue (annuity) and recovery in transaction income.
Net profit growth was muted, rising to Rs 102 crore from Rs 100 crore in the previous quarter. On an annualised basis, the bottomline fell nearly 24%.
Ebitda jumped 20% to Rs 130.6 crore an margin expanded to 50.4% from 48.6% in the March quarter.
The demat account additions moderated to 5.7 million in the quarter versus 6.4 million in Q4, but CDSL maintained its leadership position with a 84% market share.

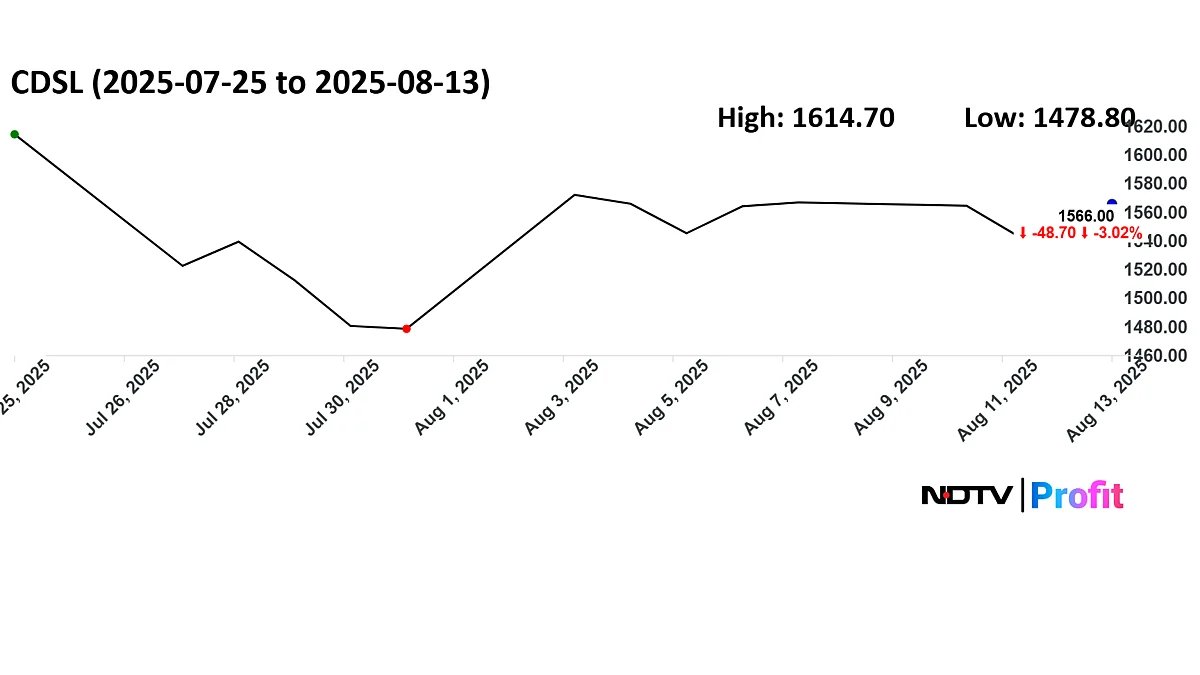
CDSL share movement since Q1 results on Junly 26.
NSDL Vs CDSL Valuation
Price-to-earnings, also known as P/E ratio, is a key indicator to guage relative valuations on companies. A high P/E means the stock is expensive.
As per data on Screener, NSDL currently trades at P/E of 74, which makes it expensive. On the other hand, CDSL trades at 66 times price-to-earnings.
The current market cap of NSDL is Rs 24,166 crore and that of CDSL is Rs 32,806 crore.
. Read more on Earnings by NDTV Profit.

