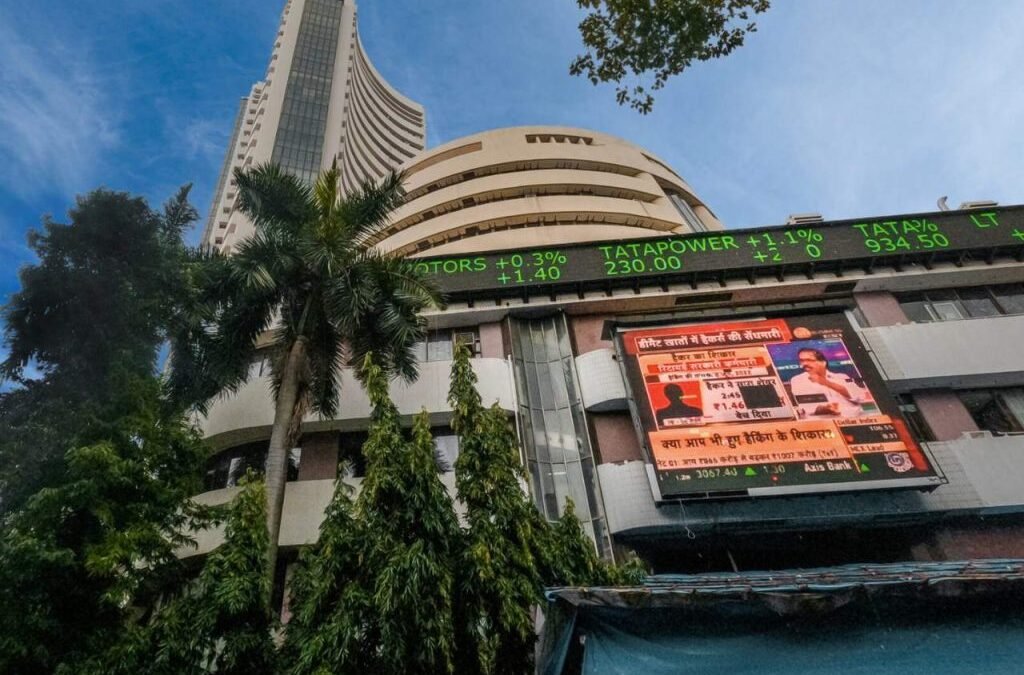
Indian equity markets continued their upward momentum on Friday, extending gains for the third straight session. Investor sentiment remained upbeat, supported by easing geopolitical tensions and favorable global cues. Both benchmark indices showed strength, with the Nifty 50 and Sensex opening on a positive note and sustaining gains throughout the day.
Broad-based buying was witnessed across most sectors, particularly in oil and gas, energy, and small-cap stocks, which led the rally. Key stocks in these sectors recorded significant gains, pushing the respective indices higher. On the other hand, realty stocks underperformed, with the Nifty Realty index ending in the red due to profit booking in heavyweight names.
Globally, Asian markets traded with mixed cues as investors digested fresh economic data from China. Despite weak industrial profit figures, sentiment in Japanese and select Chinese markets remained firm. The domestic rally this week was further supported by the weakening dollar, expectations of stronger foreign inflows, and optimism around upcoming trade discussions between India and the United States.
In this overview, we will analyze the key technical levels and trend directions for Nifty and BSE Sensex to monitor in the upcoming trading sessions. All the charts mentioned below are based on the 5-minute timeframe.
NIFTY 50 Chart & Price Action Analysis
(In this analysis, we have used 20/50/100/200 EMAs, where 20 EMA (Red), 50 EMA (Orange), 100 EMA (Light Blue), 200 EMA (Dark Blue)).
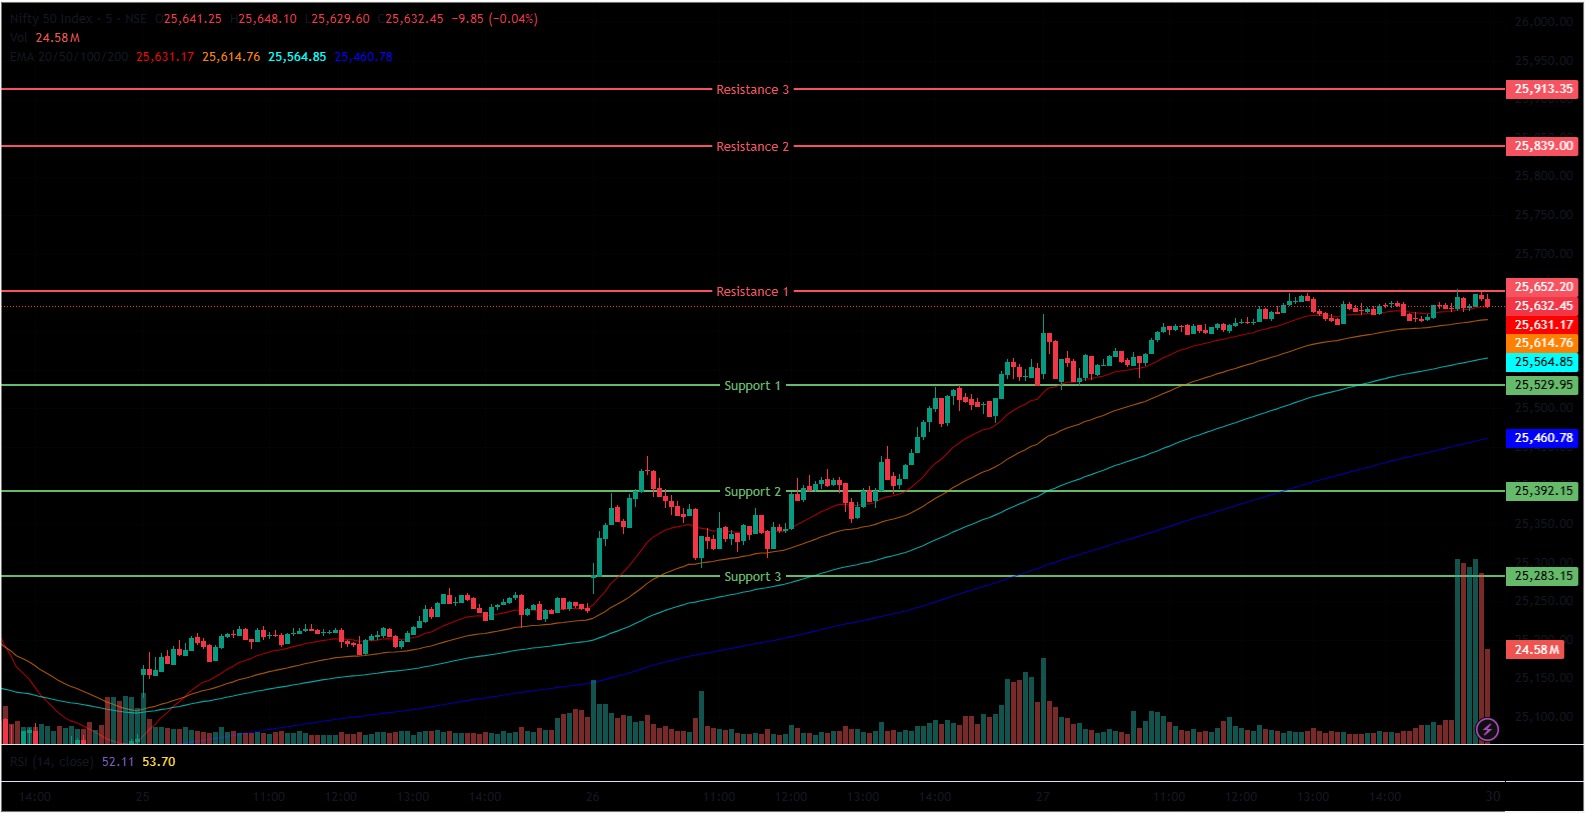
The Nifty 50 Index opened on a positive note at 25,576.65 on Friday, up by 27.65 points from Thursday’s closing of 25,549.00. The Nifty Index traded in the green in the morning session, sustaining above the 25,600 level. It was trading above the opening level, gradually rose to the 25,600 range from 25,500, and was above all four 20/50/100/200 EMAs in the 15-minute time frame in the morning session. In the afternoon session, the Nifty Index reached its day’s high at 25,654.20 and consolidated at the 25,600 range and closed at 25,637.80, and stayed above all four 20/50/100/200 EMAs in the 15-minute time frame.
Nifty’s immediate resistance levels are R1 (25,652), R2 (25,839), and R3 (25,913), while immediate support levels are S1 (25,530), S2 (25,392), and S3 (25,283). The Nifty index had reached a day’s high at 25,654.20, closed above the 25,600 mark, and saw a day’s low at 25,523.55. Finally, it had closed at 25,637.80, gaining +88.8 points or 0.35%. The Relative Strength Index (RSI) stood at 67.72 (below the overbought zone of 70) in the daily time frame, and Nifty 50 closed above the four 20/50/100/200 EMAs in the daily time frame.
Bank Nifty Chart & Price Action Analysis
(In this analysis, we have used 20/50/100/200 EMAs, where 20 EMA (Red), 50 EMA (Orange), 100 EMA (Light Blue), 200 EMA (Dark Blue)).
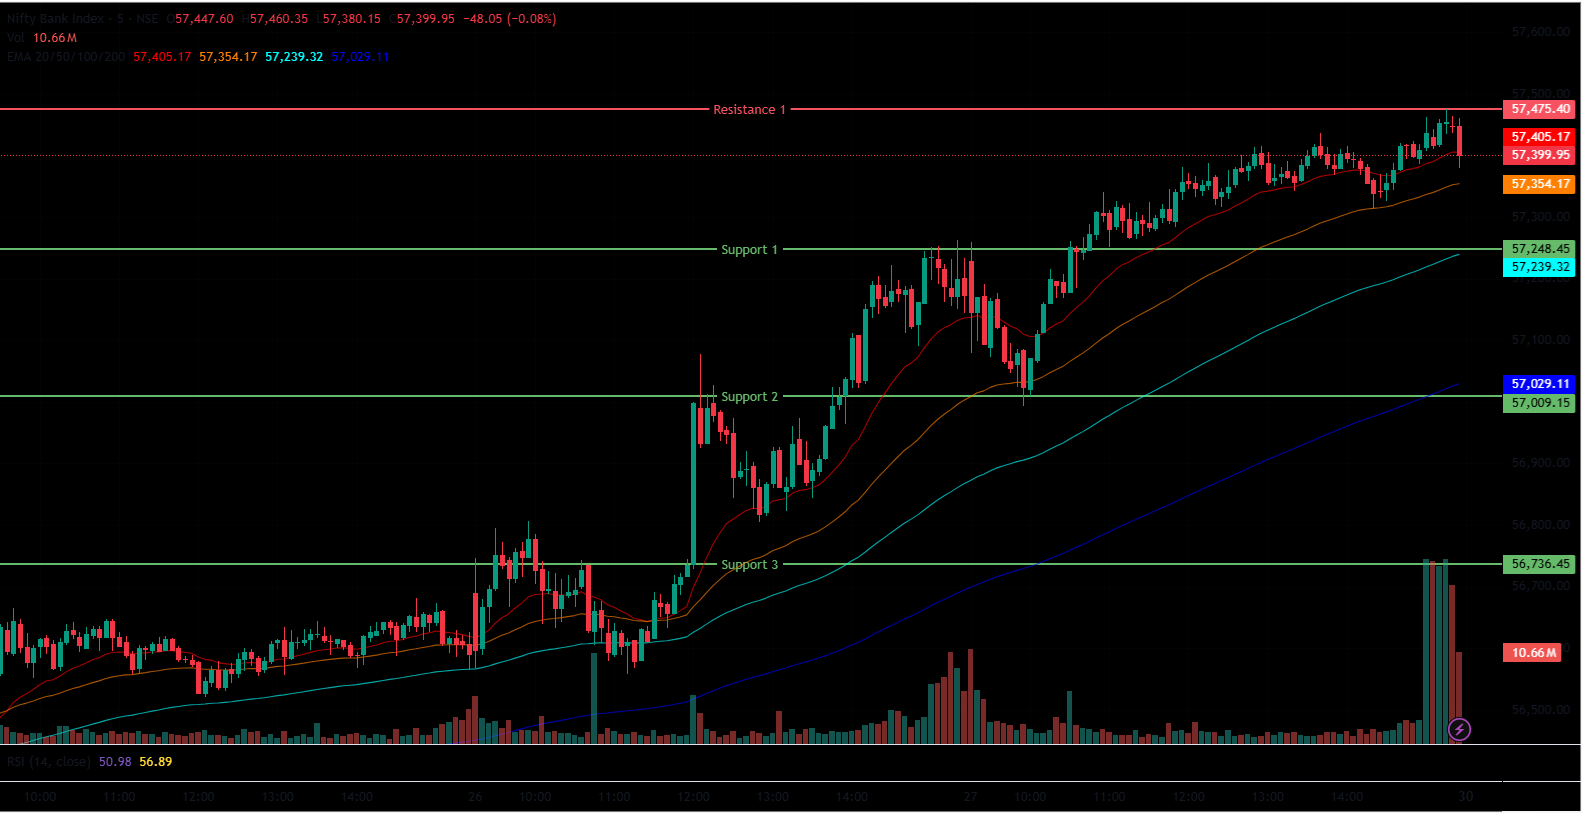
The Bank Nifty Index also followed a similar bullish trend, opening at 57,234.70. It was trading above the opening level at the 57,375 level in the morning session, in green and above all four 20/50/100/200 EMAs in the 15-minute time frame. In the afternoon session, the Bank Nifty reached its all-time high at 57,475.40 and closed around 57,443.90 while staying above all 20/50/100/200-day EMAs in the 15-minute time frame.
Bank Nifty immediate resistance levels are R1 (57,475), while immediate support levels are S1 (57,248), S2 (57,009), and S3 (56,736). The Bank Nifty index had peaked at 57,475.40, reached its all-time high level, and had a day’s low at 56,993.85. Finally, it had closed at 57,443.90, up by +237.2 points or 0.41%. The Relative Strength Index (RSI) stood at 67.31 (below the overbought zone of 70) in the daily time frame, and Bank Nifty was above the 20/50/100/200 EMAs in the daily time frame.
BSE Sensex Chart & Price Action Analysis
(In this analysis, we have used 20/50/100/200 EMAs, where 20 EMA (Red), 50 EMA (Orange), 100 EMA (Light Blue), 200 EMA (Dark Blue)).
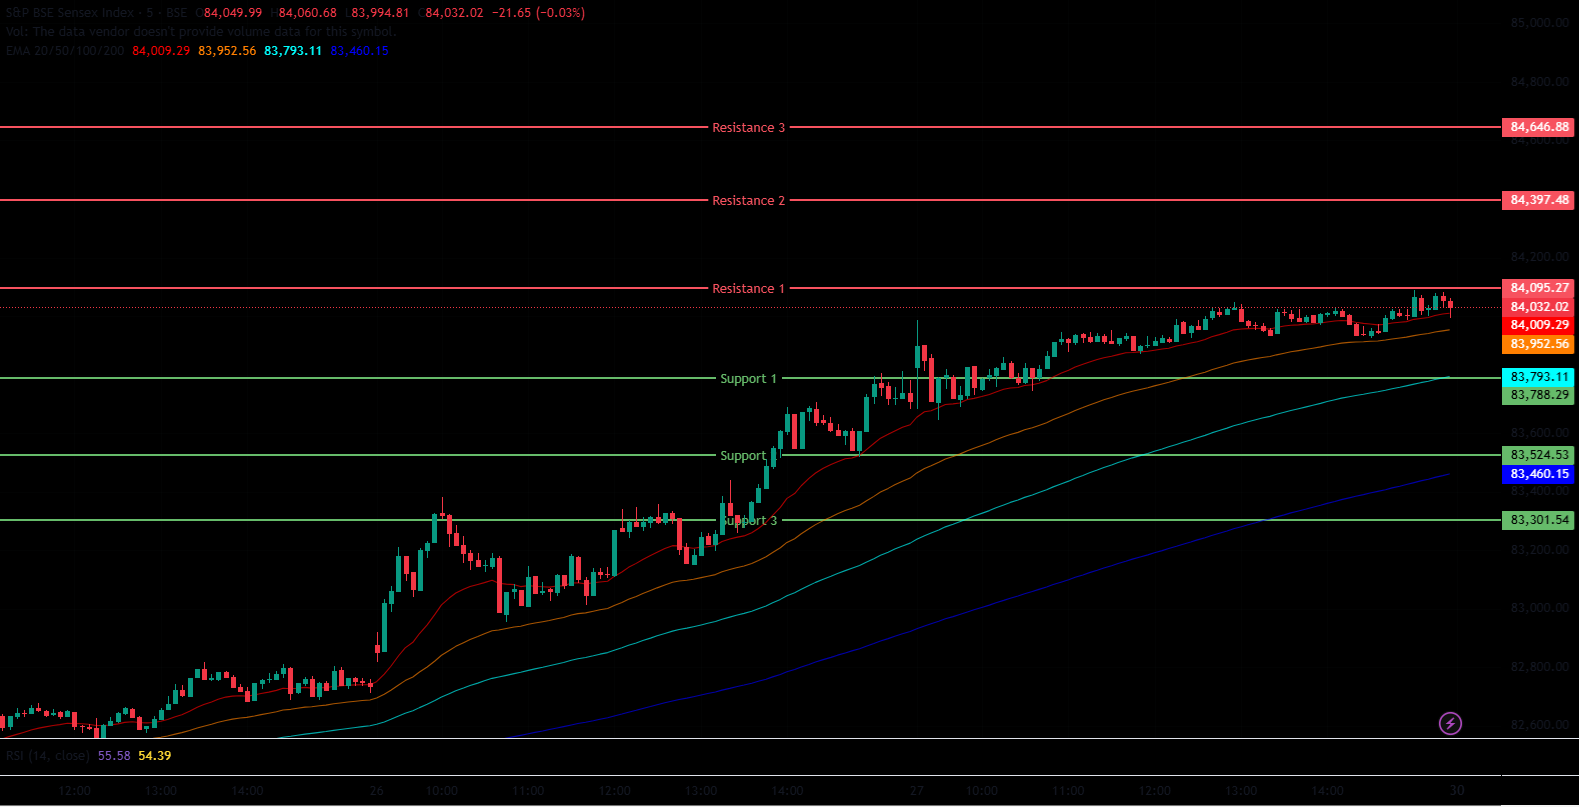
The BSE Sensex Index followed the same optimistic trend, opening at 83,774.45. It was trading above the opening level at the 84,000 level in the morning session, in green and above all four 20/50/100/200 EMAs in the 15-minute time frame. In the afternoon session, the BSE Sensex reached its day’s high at 84,089.35 and closed around 84,058.90 while staying above all 20/50/100/200-day EMAs in the 15-minute time frame. BSE Sensex immediate resistance levels are R1 (84,095), R2 (84,397), and R3 (84,647), while immediate support levels are S1 (83,788), S2 (83,525), and S3 (83,302).
The BSE Sensex index had peaked at 84,089.35 and had a day’s low at 83,645.41. Finally, it had closed at 84,058.90, up by +303.03 points or 0.36%. The Relative Strength Index (RSI) stood at 66.9 (below the overbought zone of 70) in the daily time frame, and BSE Sensex was above the 20/50/100/200 EMAs in the daily time frame.
Market Recap June 27th, 2025
The Nifty 50 opened on a positive note on Friday, extending its rally for the third consecutive session. It began the day at 25,577, rising 28 points from the previous close of 25,549. Throughout the session, the index gained 89 points, or 0.35%, touching a high of 25,654 before settling at 25,638. The Relative Strength Index stood at 67.72, nearing the overbought threshold of 70. Nifty also closed above all four key moving averages — the 20, 50, 100, and 200-day EMAs — on the daily chart.
The Sensex mirrored this momentum, closing at 84,059 with an increase of 303 points or 0.36%, and an RSI of 66.9. The ongoing rally was largely supported by easing geopolitical tensions between Israel and Iran. Additionally, the dollar index fell to a three-year low of 97 on Thursday, indicating the potential for increased foreign capital inflows into Indian equities. Continued strong demand from domestic institutional investors also played a key role.
Most sectoral indices ended in the green on Friday.
The Nifty Oil and Gas index finished at 11,835, up 139 points or 1.2%, marking its second consecutive session of gains. The rally was led by Adani Total Gas, which jumped 5.7%, followed by Mahanagar Gas and Hindustan Petroleum Corporation Ltd, both rising by around 4.5%. Gujarat State Petronet and Indraprastha Gas also posted gains of up to 3%. The Nifty Energy index moved higher as well, closing at 36,543 with a rise of 363.5 points or 1%. Stocks such as Adani Total Gas, Mahanagar Gas, HPCL, Suzlon Energy, and Reliance Power recorded gains of up to 6%, contributing to the index’s advance.
The Nifty Smallcap 100 index climbed 0.9%, or 171 points, to close at 18,977. Top performers included Himadri Speciality Chemical Ltd, which surged 12.5%, followed by Narayana Hrudayalaya Ltd with a 9.2% gain. Redington Ltd, IDBI Bank Ltd, and Godfrey Phillips India Ltd also rose up to 8.5%. On the downside, the Nifty Realty index was the only major laggard, closing at 993.95 after falling by 15.60 points or 1.6%. The decline was driven by losses in key stocks such as Phoenix Mills, Oberoi Realty, Prestige Estates, and Anant Raj, each of which declined by up to 3.5%.
Asian markets ended mixed on Friday as investors assessed China’s industrial performance for May. Data from the National Bureau of Statistics showed that industrial profits declined by 9.1% year over year in the first five months of 2025. Hong Kong’s Hang Seng closed lower at 24,284.15, down 0.17% or 41.25 points. South Korea’s Kospi declined 0.77% or 23.62 points to end at 3,055.94. Meanwhile, Japan’s Nikkei 225 gained 566.21 points or 1.43% to close at 40,150.79. In China, the Shanghai Composite Index slipped 0.7% or 24.23 points to close at 3,424.23, while the Shenzhen Index inched up by 0.34% or 35.07 points to 10,378.55.
The week began on a cautious note but picked up strong momentum as ceasefire developments eased tensions between Iran and Israel. The dollar index’s fall to 97 on Thursday added to optimism by signaling increased foreign investment prospects. Positive sentiment was also fueled by hopes for progress in US-India trade negotiations aimed at reducing tariff barriers. Nifty 50 crossed the key 25,500 mark during the week, hitting a high of 25,650. The BSE Sensex crossed the 84,000 level, reaching a weekly high of 84,089, while Bank Nifty touched an all-time high of 57,475.
India VIX
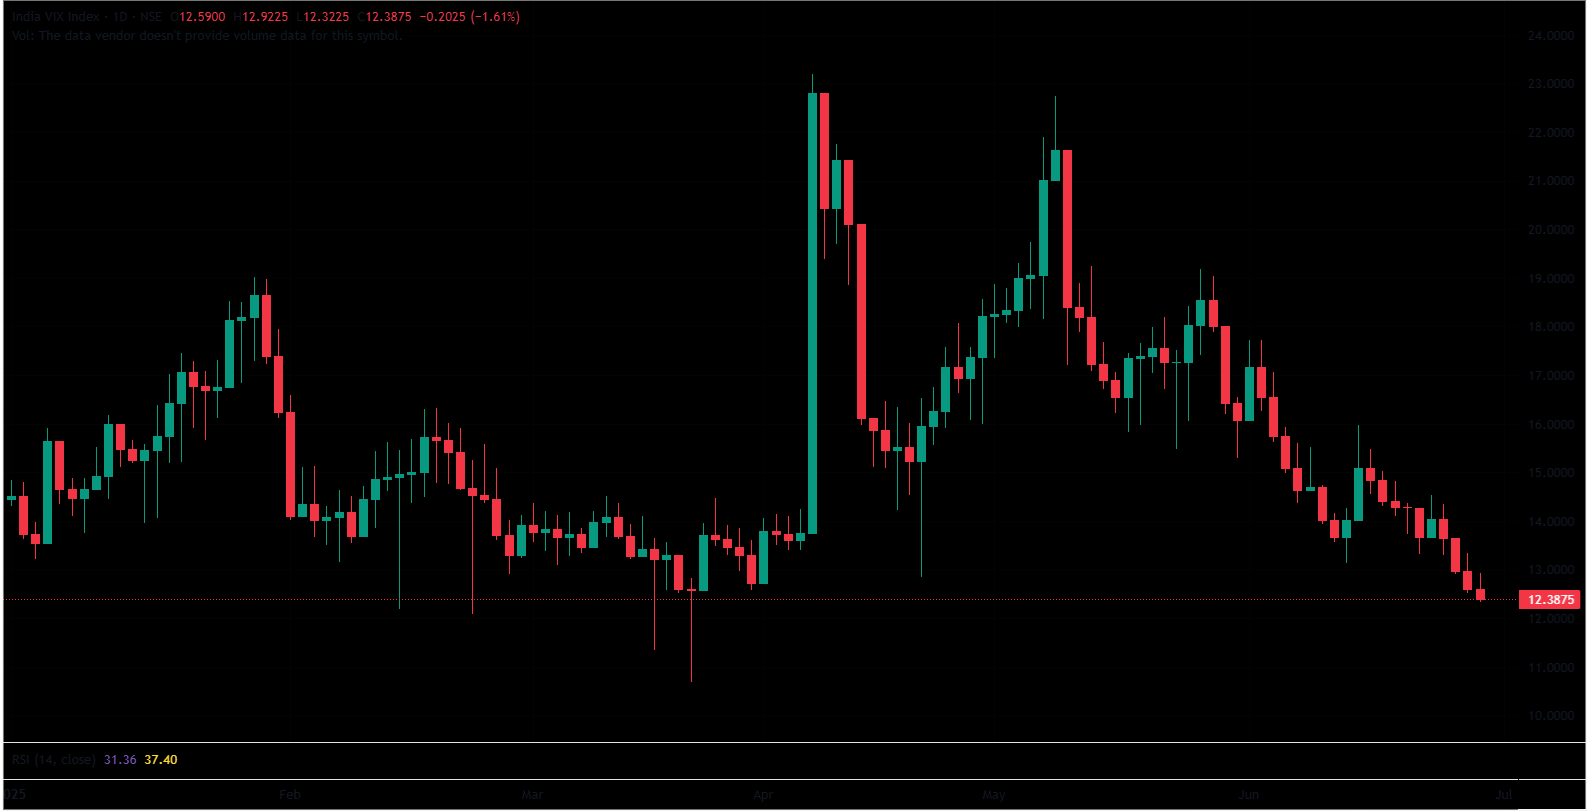
The India VIX decreased from 12.59 to 12.39 on Friday, down by -0.20 points or -1.61%. From last Friday to this Friday, the VIX reduced from 13.67 to 12.39. This frequently results in more stable markets and possibly a more favorable environment for investments. It’s important to keep in mind, though, that the India VIX represents expected volatility rather than market direction.
Trade Setup Summary
The Nifty 50 opened on a positive note on Friday and maintained its uptick throughout the morning session, sustaining above the 25,600 mark, and closed at 25,637.80, peaking at 25,654.20. A break below 25,530 could trigger further selling towards 25,392, while a break above 25,652 could trigger bullishness towards 25,839.
Bank Nifty opened on a similar trend, closing on a positive note and sustaining above the 57,400 level, peaking at 57,475.40, an all-time high. A break below 57,248 could trigger further selling towards 57,009, while the next resistance level of 57,475 could lead to new all-time high levels.
Sensex opened on a similar trend, closing on a positive note and sustaining above the 84,000 level, peaking at 84,089.35. A break below 83,788 could trigger further selling towards 83,525, while breaking the next resistance level of 84,095 could lead towards the 84,397 level.
Given the ongoing volatility and mixed sentiments, it’s advisable to avoid aggressive positions and wait for clear directional moves above resistance or below support. Traders should consider these key support and resistance levels when entering long or short positions following the price break from these critical levels. Additionally, traders can combine moving averages to identify more accurate entry and exit points.
Disclaimer

The views and investment tips expressed by investment experts/broking houses/rating agencies on tradebrains.in are their own, and not that of the website or its management. Investing in equities poses a risk of financial losses. Investors must therefore exercise due caution while investing or trading in stocks. Trade Brains Technologies Private Limited or the author are not liable for any losses caused as a result of the decision based on this article. Please consult your investment advisor before investing.
About: Trade Brains Portal is a stock analysis platform. Its trade name is Dailyraven Technologies Private Limited, and its SEBI-registered research analyst registration number is INH000015729.
Investments in securities are subject to market risks. Read all the related documents carefully before investing.
Registration granted by SEBI and certification from NISM in no way guarantee performance of the intermediary or provide any assurance of returns to investors.
The post Technical View: Nifty, Bank Nifty & Sensex Trade Setup and Key levels to watch for 30th June appeared first on Trade Brains.