

Synopsis: Tata Power Company Ltd has formed an ascending triangle on the 30-min chart, signalling a possible short-term bullish breakout.
An ascending triangle is a bullish continuation pattern marked by higher lows and a flat resistance line. The chart shows a bullish breakout above the key resistance zone near Rs 418, supported by strong buying volume. The breakout indicates strengthening momentum and suggests the possibility of further upside movement in the near term.
Tata Power Company Ltd broke above the key resistance level of Rs 418 on Tuesday and managed to stay above it, turning the level into a strong support zone. The stock closed at Rs 420.95 on the daily chart, indicating strengthening bullish momentum.
In an ascending triangle, traders typically target the nearest resistance level or project a price move equal to the triangle’s height from the breakout point, using strong volume and momentum to confirm the trade.
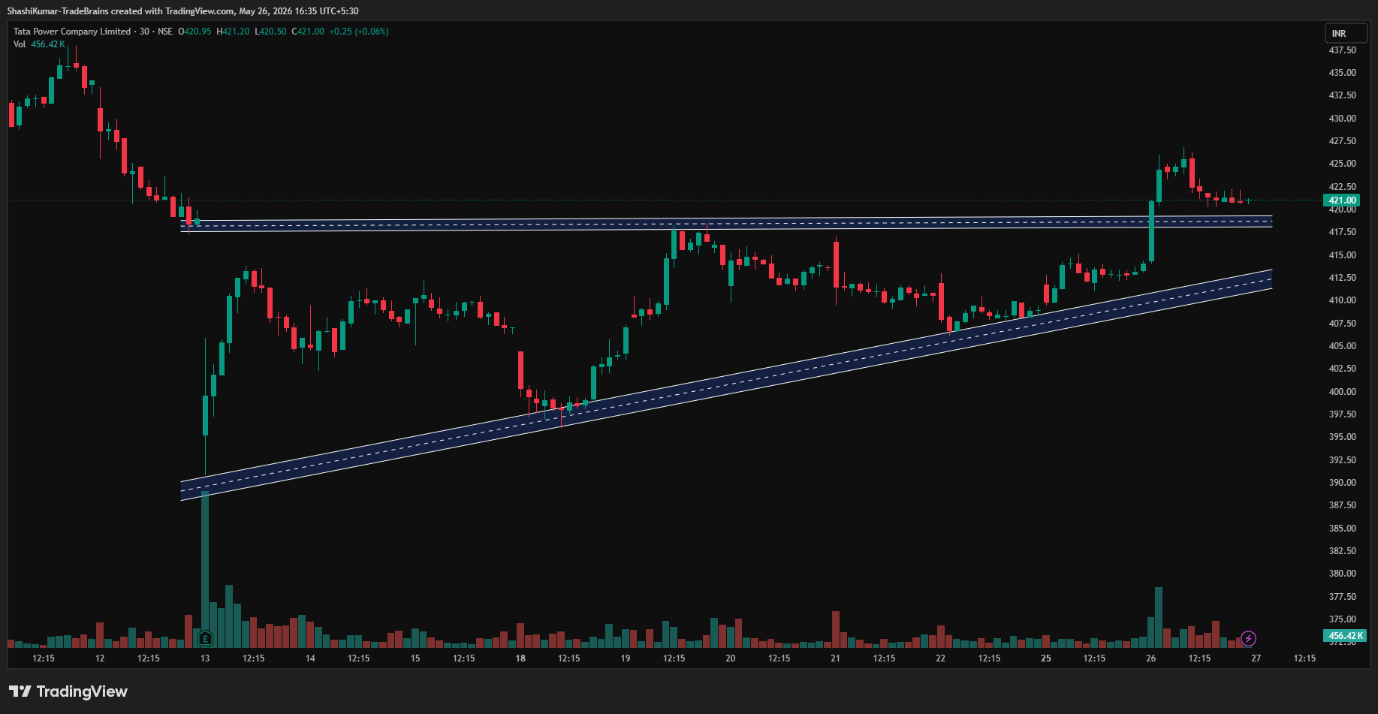
Tata Power Company Ltd Chart: 30-min Timeframe
Indicator Confirmation
- RSI: The daily RSI indicates buying pressure, as it rose from 46.60 in the previous trading session to 52.01 on Tuesday.
- Price Volume Trend: The Price Volume Indicator confirms the uptrend, accompanied by an increase in buying volume in the daily time frame.
Implications
The ascending triangle pattern suggests continued upside momentum. Holding above the Rs 418 support zone, along with strong trading volumes, could strengthen the bullish outlook in the near term.
About the stock
Tata Power Company Limited is one of India’s largest integrated power companies and a part of the Tata Group. The company operates across power generation, transmission, distribution, renewable energy, EV charging, and rooftop solar solutions. Headquartered in Mumbai, Tata Power has a strong focus on clean energy and sustainability, with growing investments in solar, wind, hydro, and electric mobility infrastructure across India.
Tata Power Company Limited has remained under pressure in the short term, declining 7.11% over the past month. However, the stock has still gained 7.54% in the last six months and delivered a 4.57% rise on a year-over-year basis. For more such technical stock ideas, clickhereto view our research page.
Disclaimer: The views and investment tips expressed by investment experts/broking houses/rating agencies on tradebrains.in are their own, and not that of the website or its management. Investing in equities poses a risk of financial losses. Investors must therefore exercise due caution while investing or trading in stocks. Trade Brains Technologies Private Limited or the author are not liable for any losses caused as a result of the decision based on this article. Please consult your investment advisor before investing.
The post Tata Power Company Forms an Ascending Triangle Pattern Hinting At a Near-Term Bullish Breakout appeared first on Trade Brains.