Synopsis: Kaynes Technology India Ltd has formed a channel-up pattern on the 1-day chart, signalling a possible short-term bearish movement.
A channel-up pattern consists of two upward-sloping parallel trendlines, with price moving between support and resistance levels. The chart shows a confirmed bearish breakout below the support neckline. Supported by volume surge and points to a potential short-term downward move.
Kaynes Technology India Ltd broke below the key support neckline on 14 May 2026 and has continued to sustain below the Rs 3,403 level till date. The level is now acting as a strong resistance zone on the daily chart, reinforcing the stock’s bearish momentum. The stock closed at Rs 3,118.20 on Monday’s session.
In a channel-up pattern, traders often project a downside target equal to the channel’s height from the breakdown point or nearest support level, while using strong selling volume and bearish momentum to confirm the move.
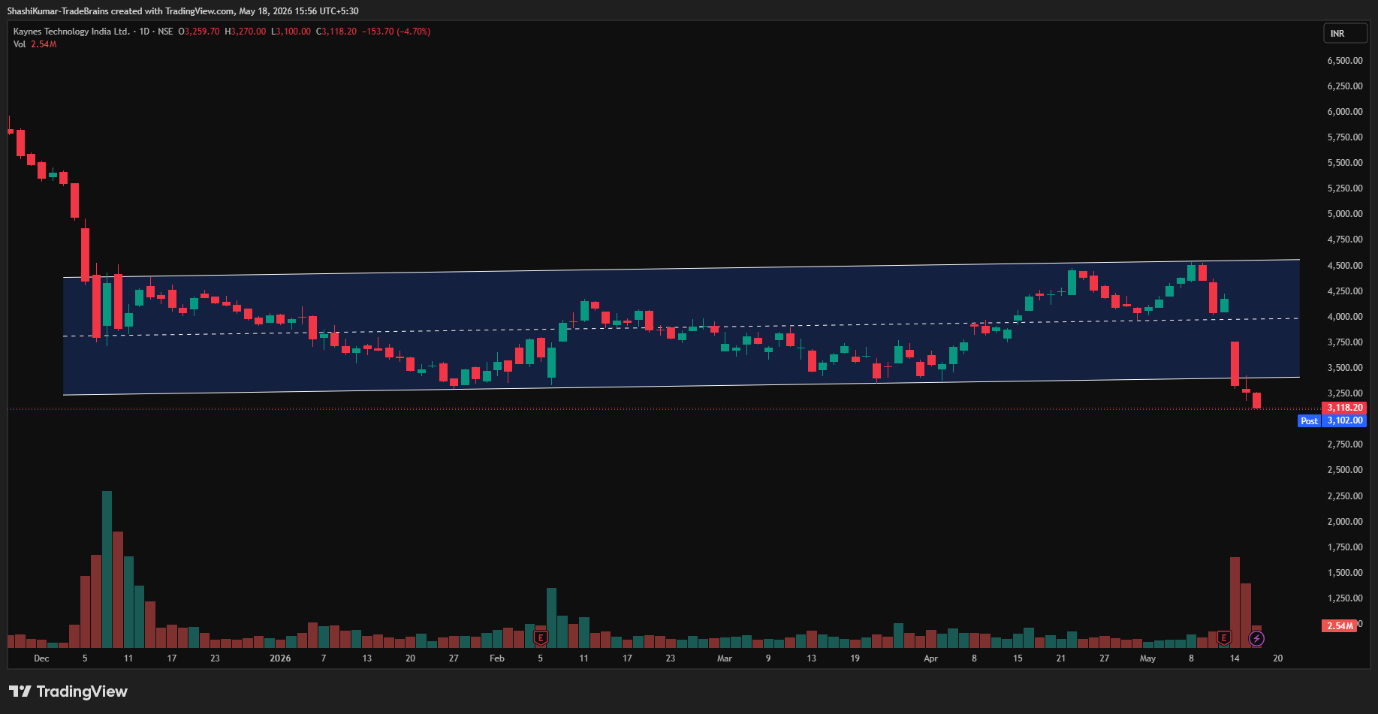
Kaynes Technology India Ltd Chart: 1-Day Timeframe
Indicator Confirmation
- MACD: On the daily time frame, the blue MACD line was below the orange signal line, with the histogram turning red, indicating bearish momentum.
- Moving Averages: On the daily time frame, the 5-day EMA was below the 9-day EMA, further confirming a bearish trend.
- RSI: The daily RSI signalled strong bearish momentum, dropped from 31.93 in the previous trading session to 29.68 on Monday, moving into the oversold zone.
- Price Volume Trend: The Price Volume Indicator confirms the downtrend, accompanied by an increase in selling volume in the daily timeframe.
Implications
The Ascending Channel Up pattern with a breakout below the support line indicates continued downside potential. Maintaining levels below the Rs 3,403 resistance mark, especially with strong trading volumes, would further strengthen the near-term bearish outlook.
About the stock
Kaynes Technology India Ltd is a leading Indian electronics manufacturing and IoT solutions company headquartered in Mysore, Karnataka. Founded in 1988, the company provides design, manufacturing, and engineering services for industries such as automotive, aerospace, defence, medical, and railways. With multiple manufacturing facilities and strong technology capabilities, Kaynes Technology is known for its advanced electronic solutions and innovation-driven approach.
Kaynes Technology India Ltd has been under strong selling pressure, falling 26.54% over the past month. The stock has also declined 47.33% in the last six months and is down 49.19% on a year-over-year basis. For more such technical stock ideas, click here to view our research page.
Disclaimer: The views and investment tips expressed by investment experts/broking houses/rating agencies on tradebrains.in are their own, and not that of the website or its management. Investing in equities poses a risk of financial losses. Investors must therefore exercise due caution while investing or trading in stocks. Trade Brains Technologies Private Limited or the author are not liable for any losses caused as a result of the decision based on this article. Please consult your investment advisor before investing.
The post Kaynes Technology Forms a Channel-Up Pattern Signalling a Short-Term Bearish Breakdown appeared first on Trade Brains.