Synopsis: Infosys Ltd has formed an ascending triangle on the 30-min chart, signalling a possible short-term bullish breakout.
An ascending triangle is a bullish continuation pattern marked by higher lows and a flat resistance line. The chart shows a confirmed bullish breakout above the resistance neckline. Supported by volume surge and points to a potential short-term upward move.
On Thursday, Infosys Ltd broke the resistance neckline and sustained above the Rs 1,180 level, which is now acting as a support zone in the 30-min. chart, reinforcing its bullish momentum.
In an ascending triangle, traders typically target the nearest resistance level or project a price move equal to the triangle’s height from the breakout point, using strong volume and momentum to confirm the trade.
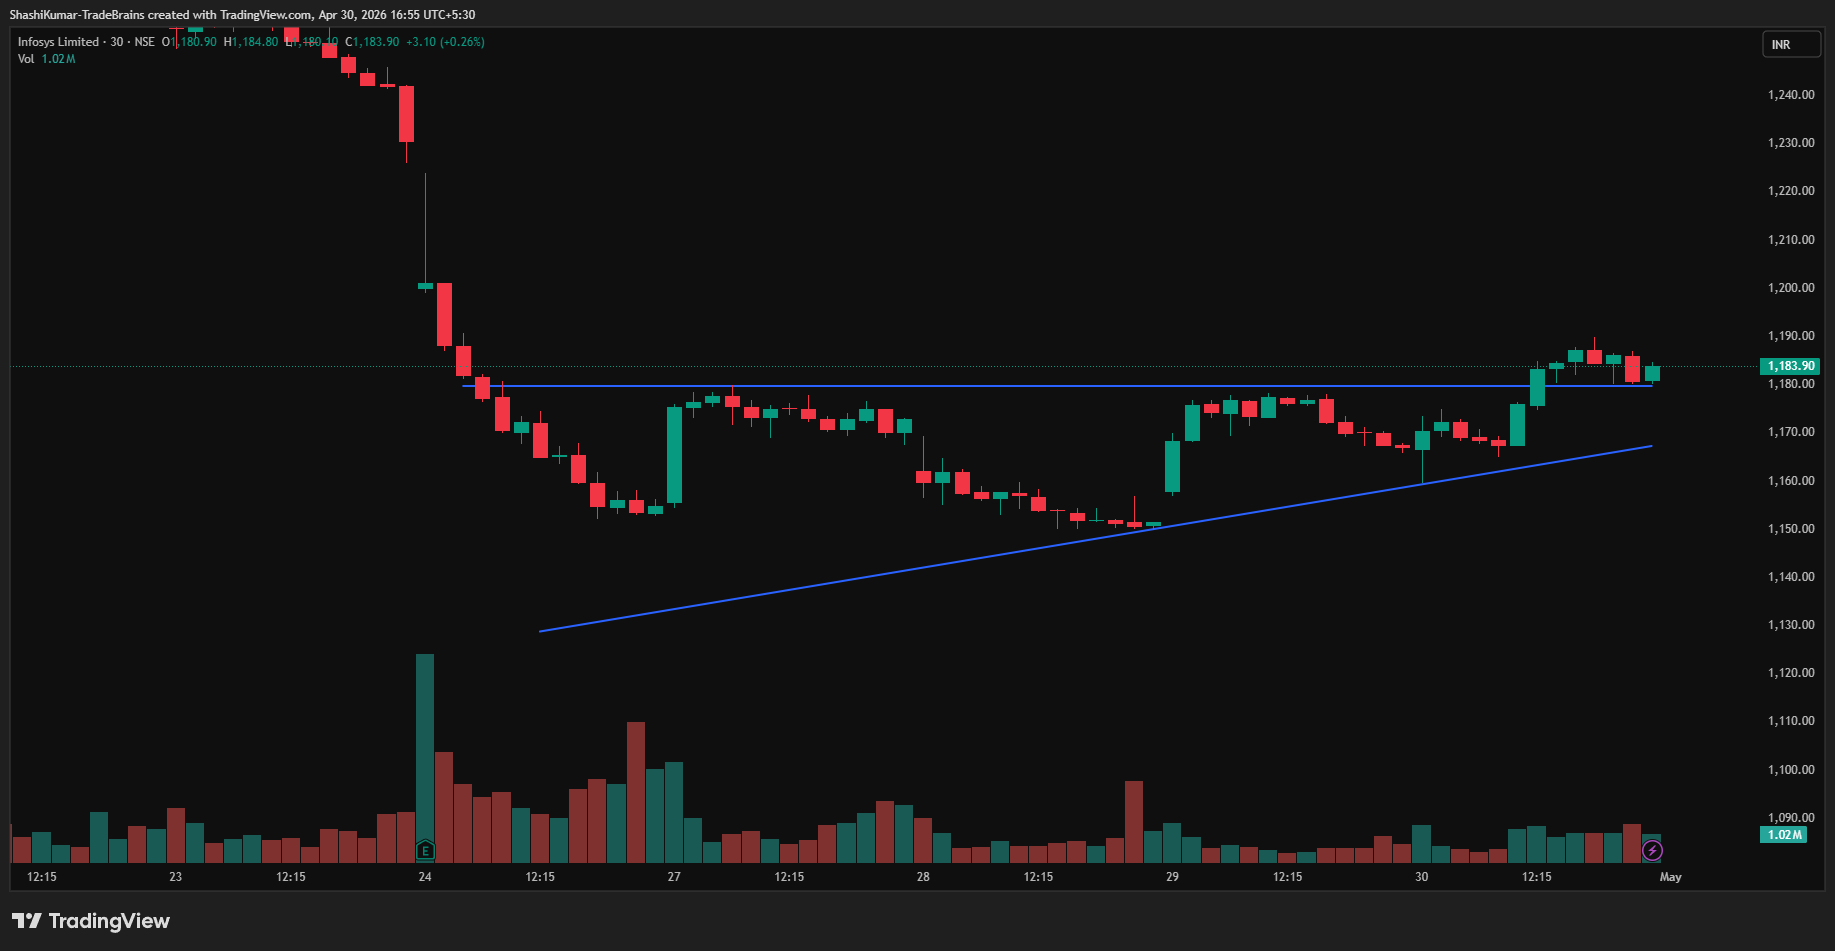
Infosys Ltd Chart: 30-min Timeframe
Indicator Confirmation
RSI: The daily RSI indicates buying pressure, as it rose from 32.72 in the previous trading session to 35.92 on Thursday.
Price Volume Trend: The Price Volume Indicator confirms the uptrend, accompanied by an increase in buying volume in the daily time frame.
Implications
The ascending triangle pattern indicates continued upside potential. Maintaining levels above the Rs 1,180 support mark, especially with strong trading volumes, would further strengthen the near-term bullish outlook.
About the stock
Infosys is a global leader in AI-first business consulting and technology services. Over 325,000 of their people work to amplify human potential and create the next opportunity for people, businesses, and communities. As navigators of enterprise transformation, the company enables businesses in 63 countries to unlock AI value at scale. With over four decades of experience in managing the systems and workings of global enterprises, they accelerate business transformation through their AI-first value framework, deep domain expertise, and unique ability to orchestrate innovations from an AI-native partner ecosystem.
Over the past month, Infosys Ltd has dropped 7.30%. The stock is down 20.22% over the past six months and down a 21.17% decrease year-over-year. For more such technical stock ideas, clickhereto view our research page.
Disclaimer: The views and investment tips expressed by investment experts/broking houses/rating agencies on tradebrains.in are their own, and not that of the website or its management. Investing in equities poses a risk of financial losses. Investors must therefore exercise due caution while investing or trading in stocks. Trade Brains Technologies Private Limited or the author are not liable for any losses caused as a result of the decision based on this article. Please consult your investment advisor before investing.
The post Infosys Shares Forms Ascending Triangle Pattern; Check The Details appeared first on Trade Brains.