Synopsis: HCL Technologies Ltd. has formed an ascending triangle on the one-hour chart, signalling a possible short-term bullish breakout.
An ascending triangle is a bullish continuation pattern marked by higher lows and a flat resistance line. The chart shows a confirmed bullish breakout above horizontal resistance. Supported by volume surge, it indicates rising buying pressure and points to a potential short-term upward move.
On Tuesday, HCL Technologies Ltd. sustained levels above Rs 1,414 and held above the ascending triangle neckline on the 1-hour chart, reinforcing its bullish momentum.
In an ascending triangle, traders typically target the nearest resistance level or project a price move equal to the triangle’s height from the breakout point, using strong volume and momentum to confirm the trade.
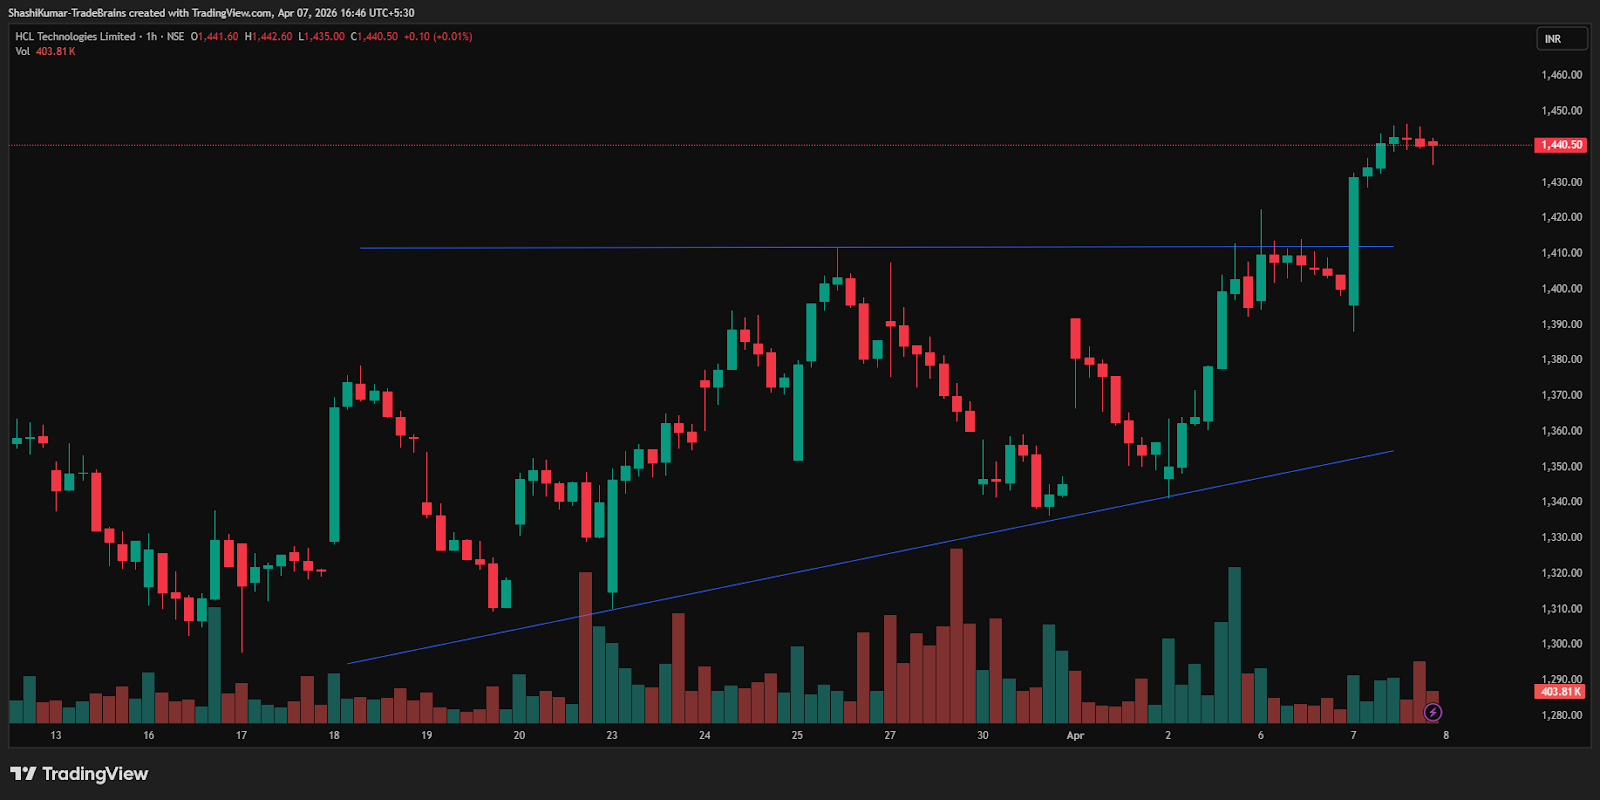
HCL Technologies Ltd Chart: 1-hour Timeframe
Indicator Confirmation
- RSI: The daily RSI rose from 52.75 in the previous trading session to 59.02 on Tuesday.
- MACD: On the daily time frame, the blue MACD line was above the orange signal line, with the histogram turning green, indicating bullish momentum.
- Moving Averages: On the daily time frame, the 5-day moving average was above the 9-day moving average, further confirming a bullish trend.
- Price Volume Trend: The Price Volume Indicator confirms the uptrend, accompanied by a sharp increase in buying volume in the daily time frame.
Implications
The ascending triangle pattern indicates continued upside potential. Maintaining levels above the Rs 1,414 support mark, especially with strong trading volumes, would further strengthen the near-term bullish outlook.
About the stock
HCLTech is a global technology company with over 226,300 employees across 60 countries. It delivers services in AI, digital, engineering, cloud, and software through a broad portfolio. The company serves major industries including financial services, manufacturing, life sciences, healthcare, high tech, telecom, retail, mobility, and public services, providing tailored solutions to clients worldwide.
Over the past month, HCL Technologies Ltd has risen 6.03%. Despite this short-term gain, the stock is only up 0.5% over the past six months and has delivered a 4.83% increase year over year. For more such technical stock ideas, click here to view our research page.
Disclaimer: The views and investment tips expressed by investment experts/broking houses/rating agencies on tradebrains.in are their own, and not that of the website or its management. Investing in equities poses a risk of financial losses. Investors must therefore exercise due caution while investing or trading in stocks. Trade Brains Technologies Private Limited or the author are not liable for any losses caused as a result of the decision based on this article. Please consult your investment advisor before investing.
The post HCL Tech Stock Shows Bullish Momentum on Ascending Triangle Breakout; Check The Details appeared first on Trade Brains.