
Synopsis: Oil India Limited has formed an inverted head-and-shoulders pattern on the 1-hour chart, indicating a potential short-term bullish reversal.
The inverted head-and-shoulders pattern signals waning selling and growing buying, hinting at a potential bullish reversal. The pattern consists of three successive troughs, where the central trough (the head) is deeper than the two surrounding troughs (the shoulders). A decisive move above the neckline typically indicates the possibility of a bullish reversal.
On Friday, Oil India Limited surpassed the neckline of an inverted head-and-shoulders pattern on the one-hour chart. A sustained rise above Rs 477 could pave the way for further gains, whereas a drop below this level might weaken near-term bullish sentiment.
In an inverted head-and-shoulders pattern, price targets are set at resistance levels or by projecting the head-to-neckline distance above the breakout, with traders trailing profits and monitoring volume and momentum for confirmation.
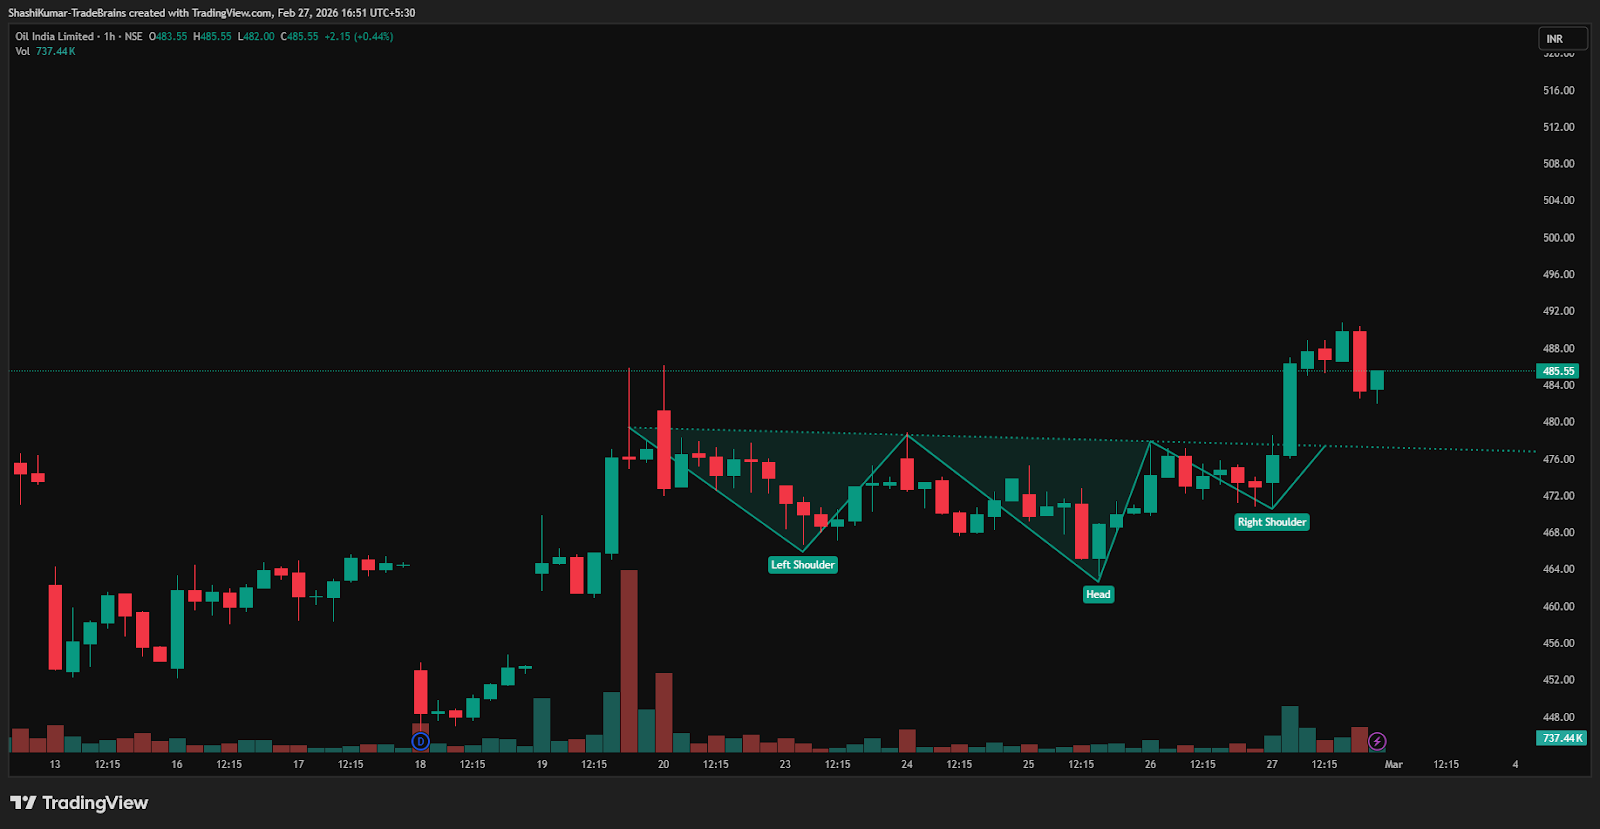
Oil India Ltd Chart: 1-hour Timeframe
Indicator Confirmation
RSI: The daily RSI indicates bullish momentum, as it rose from 52.6 in the previous trading session to 57.1 on Friday, confirming the bullish reversal.
Moving Averages: On the daily time frame, the 5-day moving average was above the 9-day moving average, further confirming a bullish trend.
Price Volume Trend: The Price Volume Indicator confirms the uptrend, accompanied by a sharp increase in buying volume in the daily time frame.
Implications
The inverted head-and-shoulders pattern suggests potential upward movement. Staying above the key Rs 477 support, supported by strong trading volumes, would strengthen near-term bullish momentum.
About the stock
Oil India Limited (OIL) is a Maharatna Central Public Sector Enterprise under the Government of India. Established in 1959, the company is a fully integrated energy leader engaged in the exploration, development, and production of crude oil and natural gas. Headquartered in Duliajan, Assam, OIL operates extensive domestic and international assets, aiming for energy security and a net-zero carbon footprint by 2040.
Over the past month, Oil India Limited has delivered a gain of 8.25%. The stock has risen 24.34% in the last six months and is up 32.70% over the past year. For more such technical stock ideas, click here to view our research page.
Disclaimer: The views and investment tips expressed by investment experts/broking houses/rating agencies on tradebrains.in are their own, and not that of the website or its management. Investing in equities poses a risk of financial losses. Investors must therefore exercise due caution while investing or trading in stocks. Trade Brains Technologies Private Limited or the author are not liable for any losses caused as a result of the decision based on this article. Please consult your investment advisor before investing.
The post Bullish Setup: Oil India Forms Inverted Head and Shoulders Pattern appeared first on Trade Brains.