
Synopsis: Fortis Healthcare Ltd is exhibited a Rounding Bottom pattern on the 30-minute chart, indicating a potential near-term bullish reversal.
The Rounding Bottom pattern signals a gradual shift in momentum, as selling pressure eases and buying interest slowly builds, supporting a potential bullish reversal.
A rounding bottom forms a gentle U-shape after a downtrend, showing fading selling and rising buying pressure. Prices stabilize at the low before gradually rising. A breakout above the curve’s neckline confirms a bullish reversal.
On Wednesday, Fortis Healthcare Ltd broke the neckline of a Rounding Bottom pattern on the 30-minute chart. A sustained move above Rs 916 level could drive further upside, while a drop below this level may weaken the bullish outlook.
In a Rounding Bottom pattern, targets are usually set near the next resistance or by measuring the formation’s depth from the breakout level. Traders often trail profits while watching volume and momentum for confirmation.
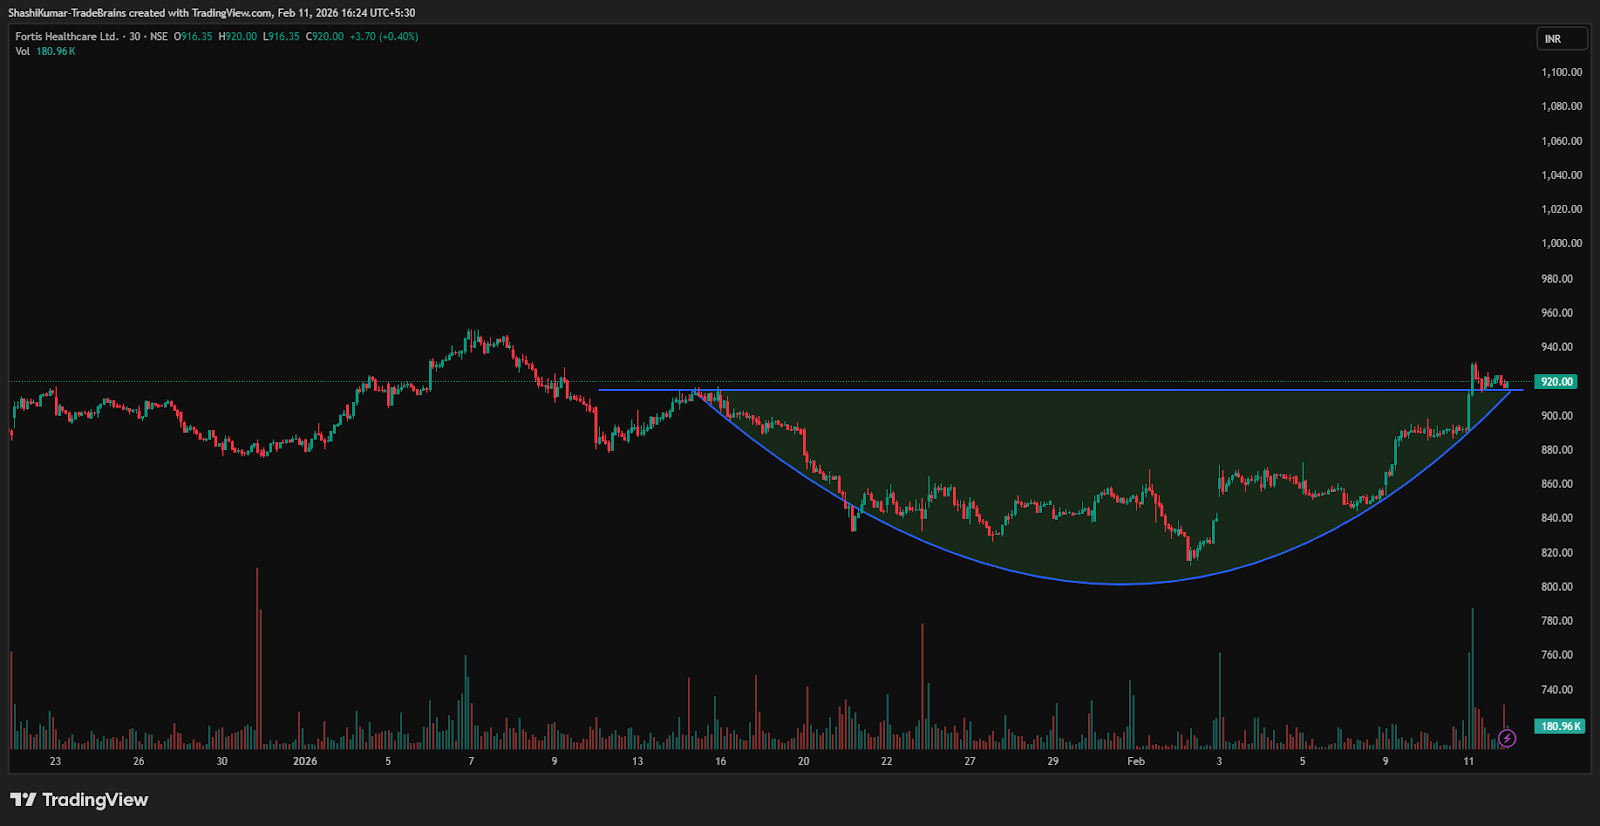
Fortis Healthcare Ltd Chart: 30-minutes Timeframe
Indicator Confirmation
RSI: The daily RSI indicates bullish momentum, as it rose from 56.9 in the previous trading session to 63.8 on Wednesday, confirming the bullish reversal.
MACD: On daily time frame, the Blue MACD line crossed above the orange signal line, with the histogram turning green, indicating bullish momentum.
Moving Averages: On daily time frame, the 5-day moving average has crossed above the 9-day moving average, further confirming a bullish trend.
Price Volume Trend: The Price Volume Indicator confirms the uptrend, accompanied by a sharp increase in buying volume in daily time frame.
Implications
The Rounding Bottom pattern indicates potential upside. As long as the stock holds above Rs 916 support, backed by strong volumes, near-term bullish momentum is likely to continue.
About the stock
Fortis Healthcare Limited is a leading integrated healthcare service provider in India, operating across hospitals, diagnostics, and day care specialty facilities. The company runs 33 healthcare facilities (including JVs and O&M units) across 11 states, with around 5,800 operational beds and more than 400 diagnostic labs nationwide.
Over the past month, Fortis Healthcare Ltd has risen 2.99%. The stock has remained largely flat over the last six months, slipping marginally by 0.07%, while delivering a strong 49.48% gain year-on-year.
Disclaimer: The views and investment tips expressed by investment experts/broking houses/rating agencies on tradebrains.in are their own, and not that of the website or its management. Investing in equities poses a risk of financial losses. Investors must therefore exercise due caution while investing or trading in stocks. Trade Brains Technologies Private Limited or the author are not liable for any losses caused as a result of the decision based on this article. Please consult your investment advisor before investing.
For more such technical stock ideas, click here to view our research page.
The post Fortis Healthcare shares hint at a near-term bullish reversal; Check the chart and key details appeared first on Trade Brains.