
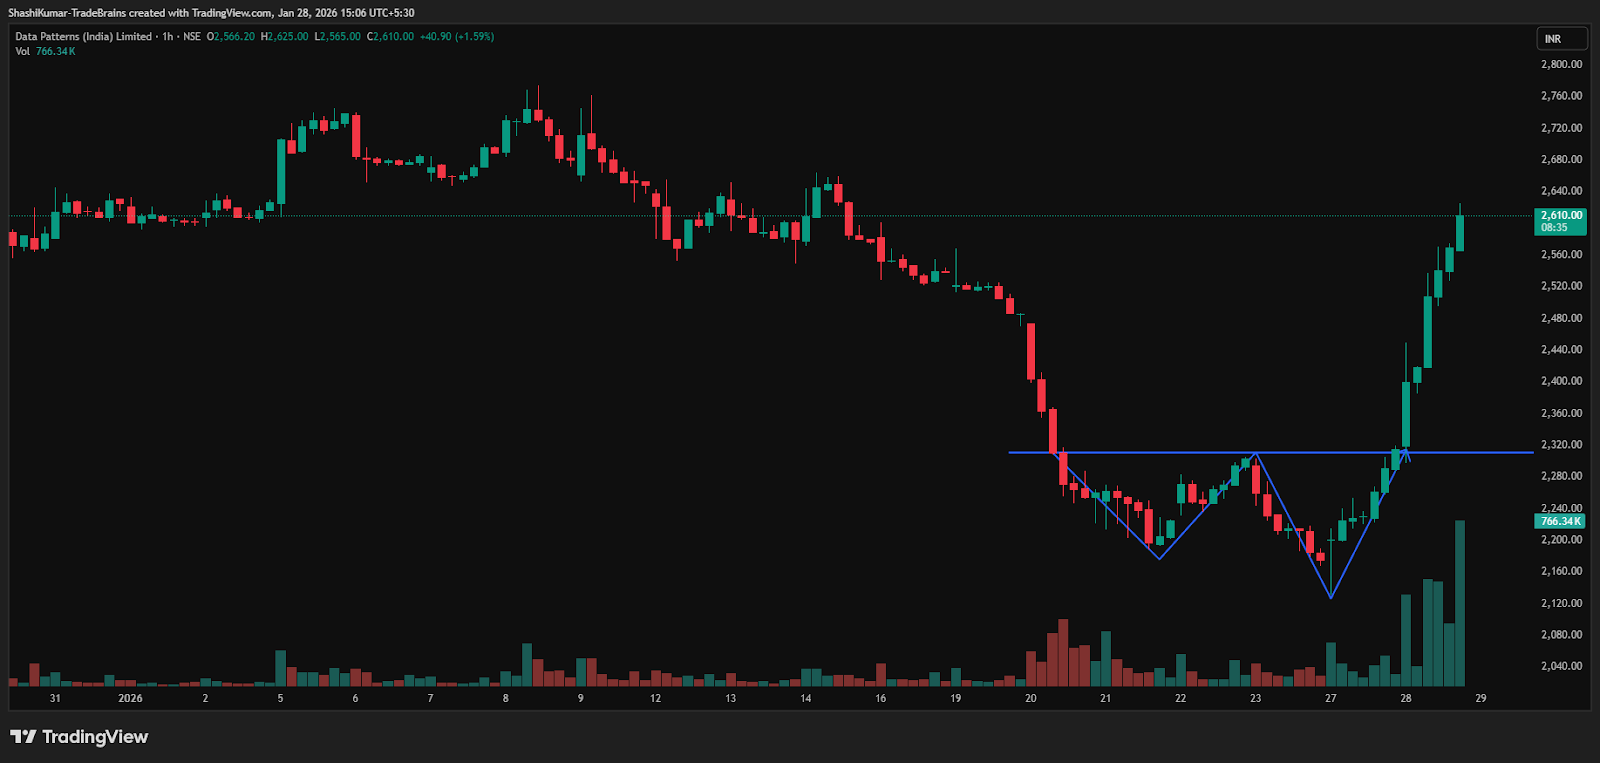
Synopsis: Data Patterns (India) Ltd has formed a double-bottom pattern on the 1-hour chart, signalling a potential near-term bullish reversal.
The appearance of a double-bottom pattern after a prolonged decline underscores strong buying support at lower levels. A breakout above the neckline points to a potential bullish reversal.
Data Patterns (India) Ltd Chart:
The double-bottom pattern indicates a potential trend reversal following a decline, with prices forming two comparable lows near a key support zone. A decisive breakout above the neckline reflects strengthening buying interest, signalling a loss of seller control and the possibility of building upside momentum.
On Wednesday, Data Patterns (India) Ltd formed a double-bottom pattern on the 1-hour chart and successfully broke the neckline, supported by rising buying interest, indicating emerging near-term bullish momentum. Following the breakout, the stock rallied more than 13% in a single day. Continued trading above the neckline could strengthen the upside potential and confirm the trend reversal signal.
In a double-bottom formation, upside targets are usually identified using the immediate resistance levels above the neckline. Traders commonly use these zones to book partial or full profits, while closely tracking price action for continuation or early signs of exhaustion.
1-hour Timeframe
Indicator Confirmation
RSI: The daily RSI indicates bullish momentum, as it rose from 37 in the previous trading session to 53.66 on Wednesday, confirming the continuation of the reversal.
MACD: On 1-hour time frame, the Blue MACD line crossed above the orange signal line, with the histogram turning green, indicating bullish momentum.
Moving Averages: On the 1-hour time frame, the 5-day moving average has crossed above the 9-day moving average, further confirming a bullish trend.
Price Volume Trend: The Price Volume Indicator confirms the trend, supported by a sharp increase in buying volume.
Implications
The emergence of a double-bottom pattern points to potential upside ahead. A sustained close above the key Rs 2,300 level, preferably with stronger buying volumes, would confirm the reversal and lower the risk of a false breakout. With the earlier resistance around Rs 2,300 now acting as immediate support, holding above this zone would reinforce bullish momentum in the near term.
About the stock
Data Patterns is a defence electronics company with core expertise in the design and development of electronic hardware, software, firmware, and mechanical systems, along with product prototyping and testing. Its capabilities span radars, electronic warfare, communications, avionics, and space applications, supporting programmes such as Tejas, LUH, and BrahMos, while working closely with HAL, BEL, DRDO, and ISRO.
Over the past month, Data Patterns (India) Ltd has declined by 1.90%, reflecting continued weakness. However, the stock has posted a 1.31% gain over the last six months and remains up a strong 26.11% year on year. For more such technical stock ideas, click here to view our research page.
Disclaimer: The views and investment tips expressed by investment experts/broking houses/rating agencies on tradebrains.in are their own, and not that of the website or its management. Investing in equities poses a risk of financial losses. Investors must therefore exercise due caution while investing or trading in stocks. Trade Brains Technologies Private Limited or the author are not liable for any losses caused as a result of the decision based on this article. Please consult your investment advisor before investing.
The post Double Bottom Pattern: Defence Stock Signals Potential Near-Term Bullish Reversal appeared first on Trade Brains.