
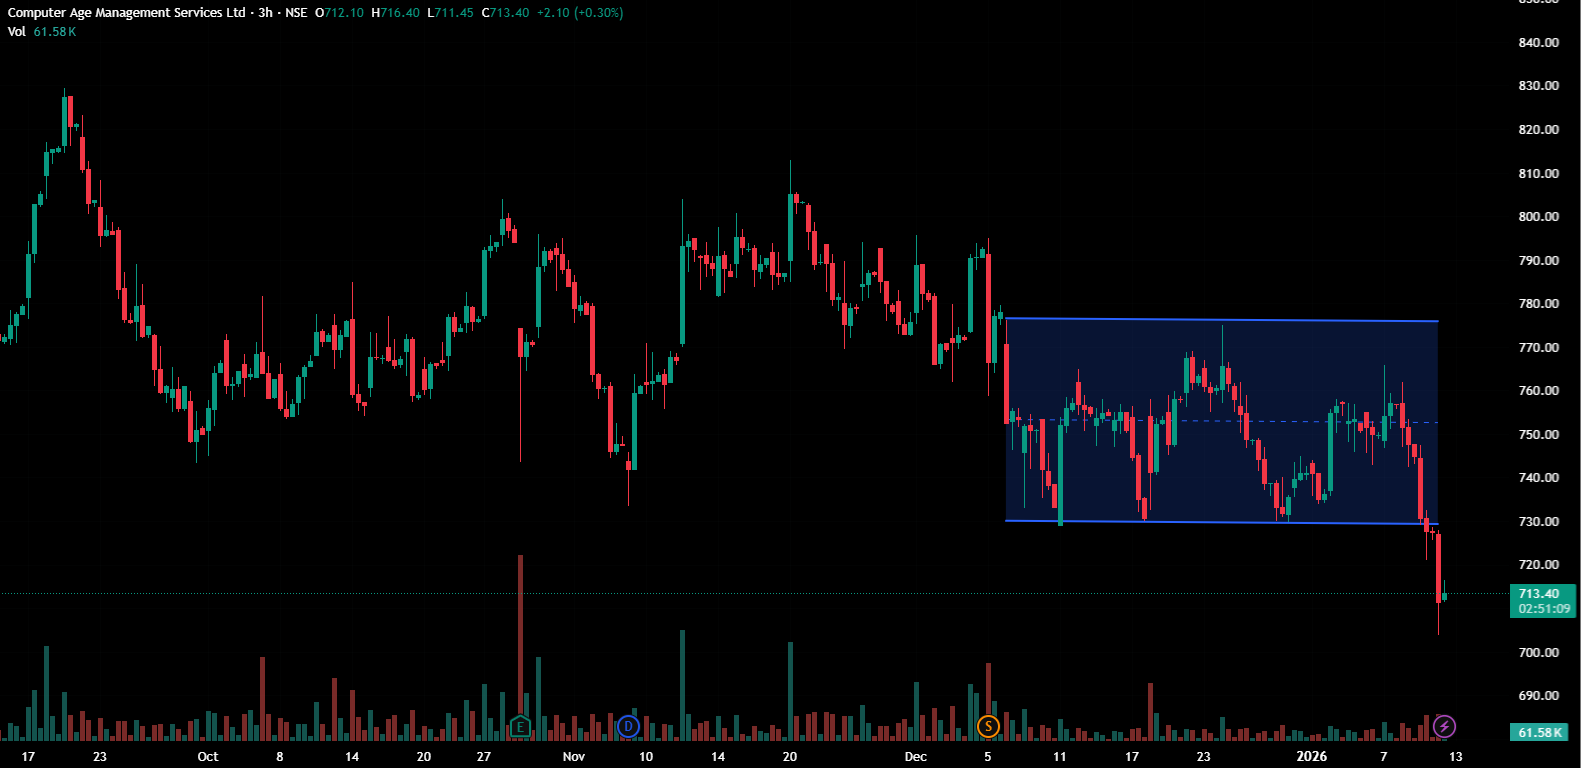
The Stock after a phase of sideways consolidation in recent sessions, has formed a rectangular channel pattern on its 3-hour chart, with a downside breakout indicating a potential bearish continuation. The rectangular channel pattern represents a consolidation phase where price oscillates between parallel support and resistance levels. A decisive breakdown below the lower boundary signals a bearish continuation, indicating that sellers have gained control, and downside momentum may accelerate.
On Friday, CAMS formed a lower high within the rectangular consolidation channel, before decisively breaking below the key support level of Rs 730 on Monday. The breakdown, coupled with subdued buying volumes, signals the emergence of near-term bearish momentum.
For a rectangular channel pattern, the downside target is calculated by measuring the height of the consolidation range and projecting that distance downward from the breakdown point. Traders typically use this projection to set profit targets, often booking partial or full gains near the target while reassessing positions as prices approach potential support zones.
Indicator Confirmation
- RSI: The daily RSI indicates persistent bearish momentum, as it declined from ~39.5 in the previous trading session to 34.6 on Monday, confirming the continuation of the downtrend.
- MACD: The orange signal line crossed above the Blue MACD line, with the histogram turning red, indicating bearish momentum.
- Moving Averages: On the 3-hour time frame, the 5-day moving average has crossed below the 9-day moving average, further confirming a bearish trend.
- Price Volume Trend: The Price Volume Indicator confirmed the downtrend, supported by a sharp decline in buying volumes.
Implications
The breakdown from the bearish rectangular channel indicates scope for further downside. A sustained close below the key Rs 730 support, preferably accompanied by increased selling volume, would confirm the validity of the breakdown and reduce the risk of a false signal. The former support around Rs 730 has now turned into immediate resistance, and continued trading below this level would reinforce bearish control in the near term.
About the stock
Computer Age Management Services (CAMS) is a leading financial infrastructure and services provider to India’s asset management industry, offering technology-enabled, platform-based solutions across the BFSI sector. The company is India’s largest registrar and transfer agent (RTA) for mutual funds, commanding an aggregate market share of approximately 68% based on mutual fund average assets under management (AAuM). CAMS serves ten of the country’s fifteen largest mutual fund houses, reflecting its strong market position and deep integration within the industry.
Over the past month, CAMS Ltd has declined by 5.75%, reflecting a phase of prolonged sideways consolidation. The stock is down 13.77% over the last six months and has registered a 16.88% decline over the past year. For more such technical stock ideas, Click here to view our research page.
Disclaimer: The views and investment tips expressed by investment experts/broking houses/rating agencies on tradebrains.in are their own, and not that of the website or its management. Investing in equities poses a risk of financial losses. Investors must therefore exercise due caution while investing or trading in stocks. Trade Brains Technologies Private Limited or the author are not liable for any losses caused as a result of the decision based on this article. Please consult your investment advisor before investing.
The post Technical Analysis: Channel Breakdown Signals Near-Term Weakness in this Financial Services Stock appeared first on Trade Brains.