Amid growing speculation about a potential market bubble, Federal Reserve Chair Jerome Powell acknowledged that “by many measures… equity prices are fairly highly valued”. His comments on Tuesday came as multiple key valuation metrics reached levels not seen since the dot-com crash.
Buffett Indicators Flashes Warning Signals
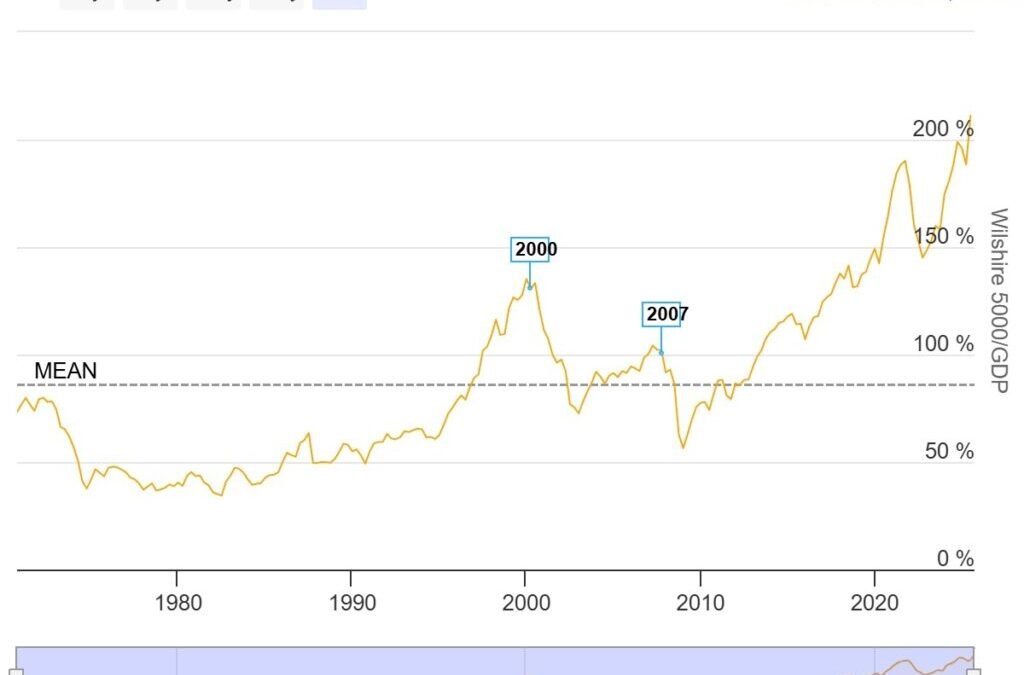
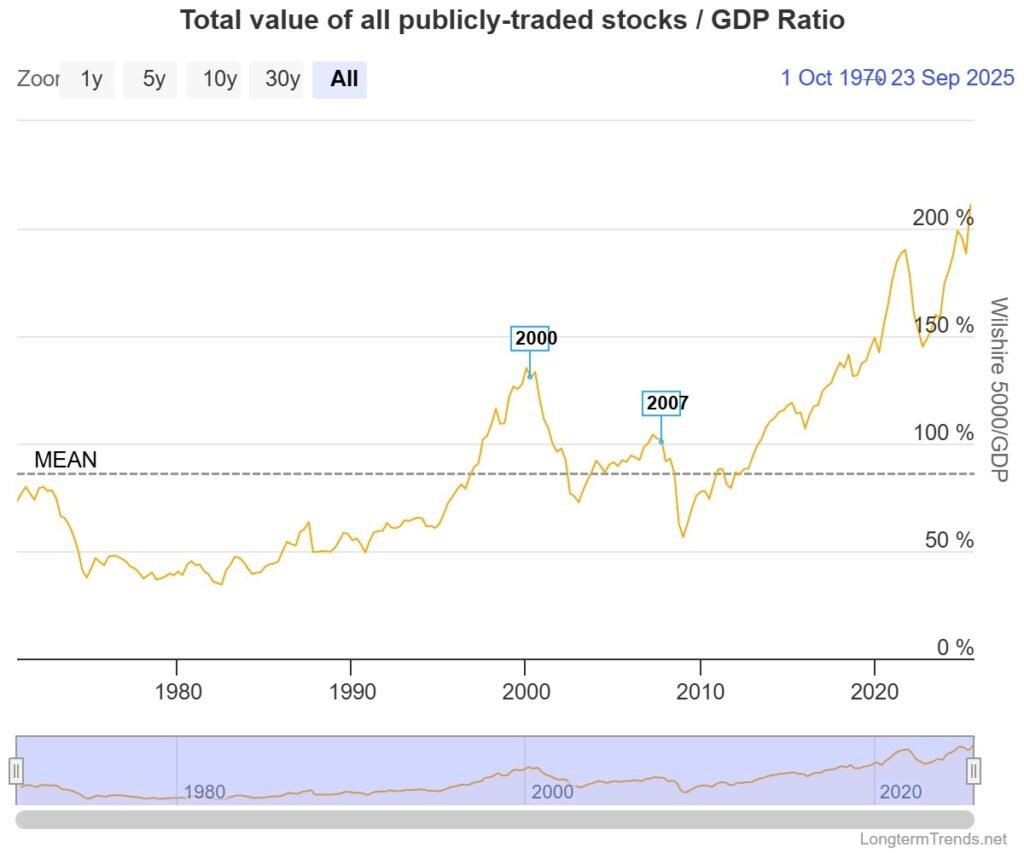
Two of the most closely watched long-term indicators are fueling the debate. The Total Market Cap to GDP ratio, often referred to as the “Buffett Indicator,” has surged to 216.6%, significantly above its historical average, according to data from LongTermTrends.
Valuation Ratios Indicate Stocks Are Overpriced
Simultaneously, the Shiller Cyclically-Adjusted Price-to-Earnings (CAPE) ratio, which measures stock market valuation by averaging earnings over 10 years and adjusting for inflation, has surpassed 40 for the first time since 2000, nearing its all-time high of 44.19 reached in December 1999.
This has prompted analysts to look for historical parallels to the current AI-driven market euphoria, which appears concentrated in a handful of mega-cap stocks.
The forward P/E …