To gain an edge, this is what you need to know today.
25 Or 50 BPS Rate Cut
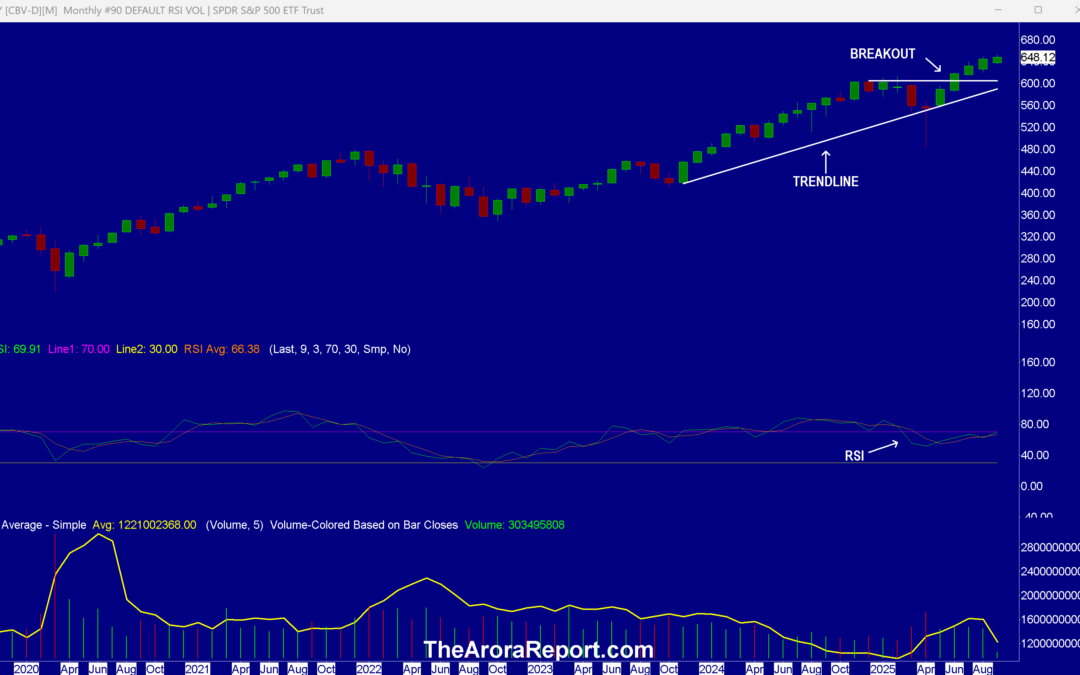
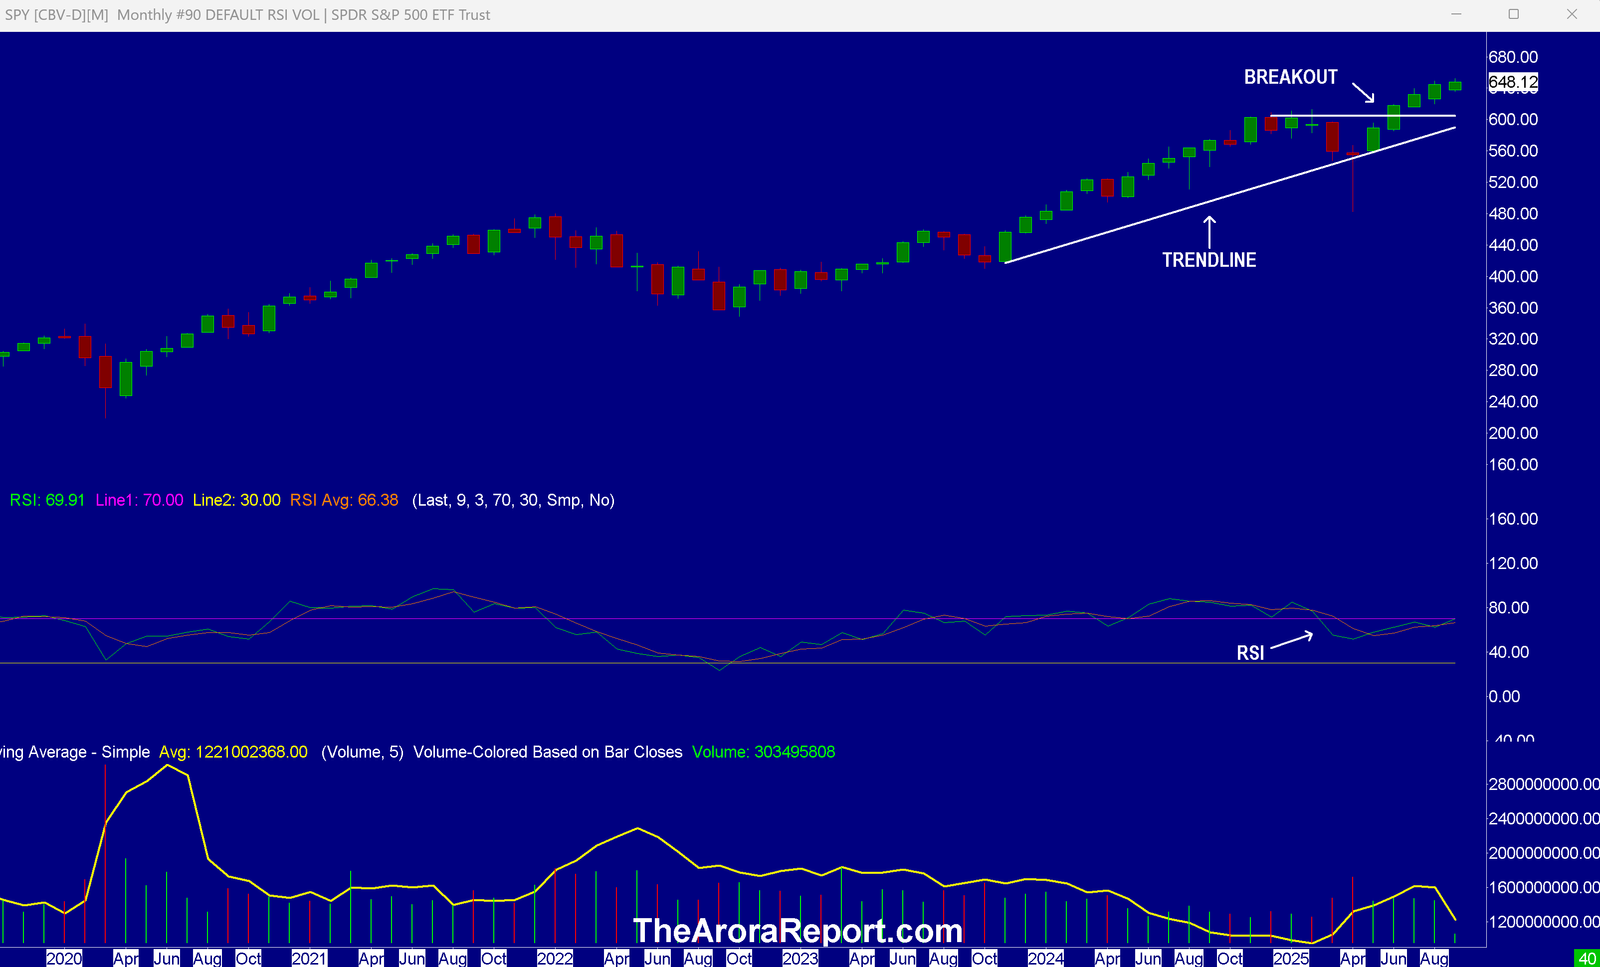
Please click here for a chart of SPDR S&P 500 ETF Trust (NYSE:SPY) which represents the benchmark stock market index S&P 500 (SPX).
Note the following:
- The chart of SPY is a monthly chart to give you a long term picture.
- The chart shows when the stock market broke out in June.
- The chart shows September is on track to be the fifth consecutive positive month.
- The chart shows the stock market is above the trendline.
- RSI on the chart shows the stock market is not overbought even given the gains since June.
- Important inflation data is ahead. Producer Price Index (PPI) will be released on Wednesday at 8:30am ET. Consumer Price Index (CPI) will be released on Thursday at 8:30am ET.
- We previously shared with readers that the probability of a rate cut in September is 99%.
- The inflation data this week will determine if the rate cut is 25 bps or 50 bps.
- Understanding positioning gives investors an edge. Positioning is an important Wall Street mechanic.
- In our analysis, Wall Street is positioned for “bad news is good news.” Even if there is bad news in the upcoming inflation data this week, Wall Street believes it will be a positive for the stock market because the release of the inflation data will lift the overhang.
- What if the inflation data is much worse than expected? Momo gurus already have an answer to …